Medicus Pharma's Report Tests Cash Runway After 89% Collapse In Share Price
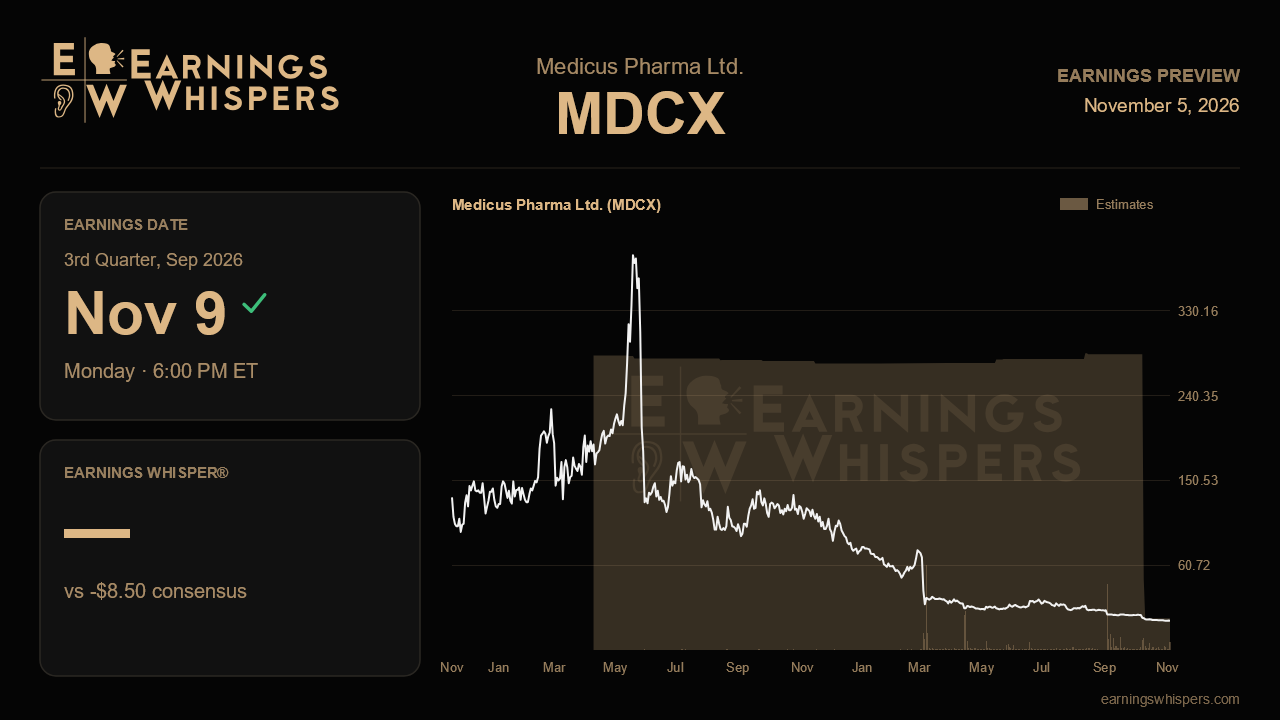
Few biotech shares have had a rougher stretch than Medicus Pharma. Since its last quarterly report, the stock has lost roughly 89% of its value while the S&P 500 slipped only about 1%. The upcoming release, due after the close on November 9, arrives less as a test of earnings power than as a check on whether the company's financial footing and development plans still hold together.
The headline number needs careful reading. Analysts expect a loss of $8.50 per share, which looks like a 1,200% deterioration from the $0.65 loss in the year-ago quarter and an enormous jump from last quarter's $0.21 loss. That comparison is probably misleading. The stock traded between $0.25 and $0.49 in the prior quarter, then reached as high as $18.40 after the last report before sliding to its current $1.88. A move of that shape in both the share price and the per-share loss estimate points to a change in the share base rather than a twelvefold increase in spending. That means the per-share figures are not on a like-for-like basis. The more useful measures will be total operating expenses, net loss in dollars and the cash balance, not the EPS print.
That is especially true because Medicus has no revenue consensus and no formal guidance on the record. For a company built around accelerating clinical development of outside therapeutic assets, the income statement is mostly a record of research and administrative spending. The questions that matter are simple. How much cash did the company burn in the quarter? How many months of operations does the remaining balance fund? Will more capital be needed before the next meaningful clinical readout? Steady or declining spending alongside a clear runway would ease concerns. A sharp rise in costs, a thin cash cushion or new reliance on equity raises would confirm the market's darkest reading of the past few months.
The absence of fresh management commentary makes the release itself the main source of information. Shareholders will want concrete updates on trial timelines, enrollment and any regulatory steps. Development milestones that stay on schedule would suggest the selloff overshot. Delays, narrowed programs or vague timing would suggest the market was right to reprice the story. Any detail on financing terms also matters, since a stock near $2 makes new equity far more dilutive than it was when shares traded in the high teens.
Sentiment has shifted in an interesting way. Going into the last report, the mood was as negative as it gets, with readings pinned at fully bearish. Today it sits essentially neutral, only a hair below zero. That is not optimism, but it does suggest the reflexive pessimism has faded after a brutal decline. Some of the bad news may already be in the price, though sentiment is no guide to what the numbers will show.
The chart offers little comfort. Shares sit about 10% above the post-report low of $1.71 and far below the 200-day moving average near $22. Nothing in that setup suggests a breakout is close; the stock is trading near the bottom of its range and could easily retest that low. A reassuring update could stabilize the shares, while a disappointing one leaves very little support beneath them.
In the end, this report hinges on one question: whether Medicus can show that its cash and development progress justify confidence in the plan after an 89% collapse. A credible runway and on-track milestones would let the story be rebuilt from a far lower base. Further cash strain or slipping timelines would suggest the decline reflected real damage rather than mere panic.
This earnings preview was originally published on Earnings Whispers.
This article is for informational purposes only and is not investment advice. Earnings Whispers and its staff may hold positions in the securities mentioned. It is AI-assisted, based on proprietary Earnings Whispers data and company reports, and edited by Earnings Whispers staff.
Mentioned In This Article
Latest News
| 36 min | |
| Nov-06 | |
| Nov-05 | |
| Nov-05 | |
| Nov-04 | |
| Nov-04 | |
| Nov-04 | |
| Nov-04 | |
| Oct-27 | |
| Oct-27 | |
| Oct-26 | |
| Oct-08 | |
| Oct-08 | |
| Oct-08 | |
| Sep-29 |
