Boyd Group Needs Margin Proof As Street Expects 55% EPS Jump On Flat Sequential Sales
The most revealing number in Boyd Group's upcoming report may not be revenue at all. Wall Street expects the collision repair operator to post sales roughly in line with last quarter, yet it is penciling in a sharp step up in profit per share. That gap puts the burden squarely on margins and cost control, and it arrives just as the stock has slid well behind the broader market since the company last reported.
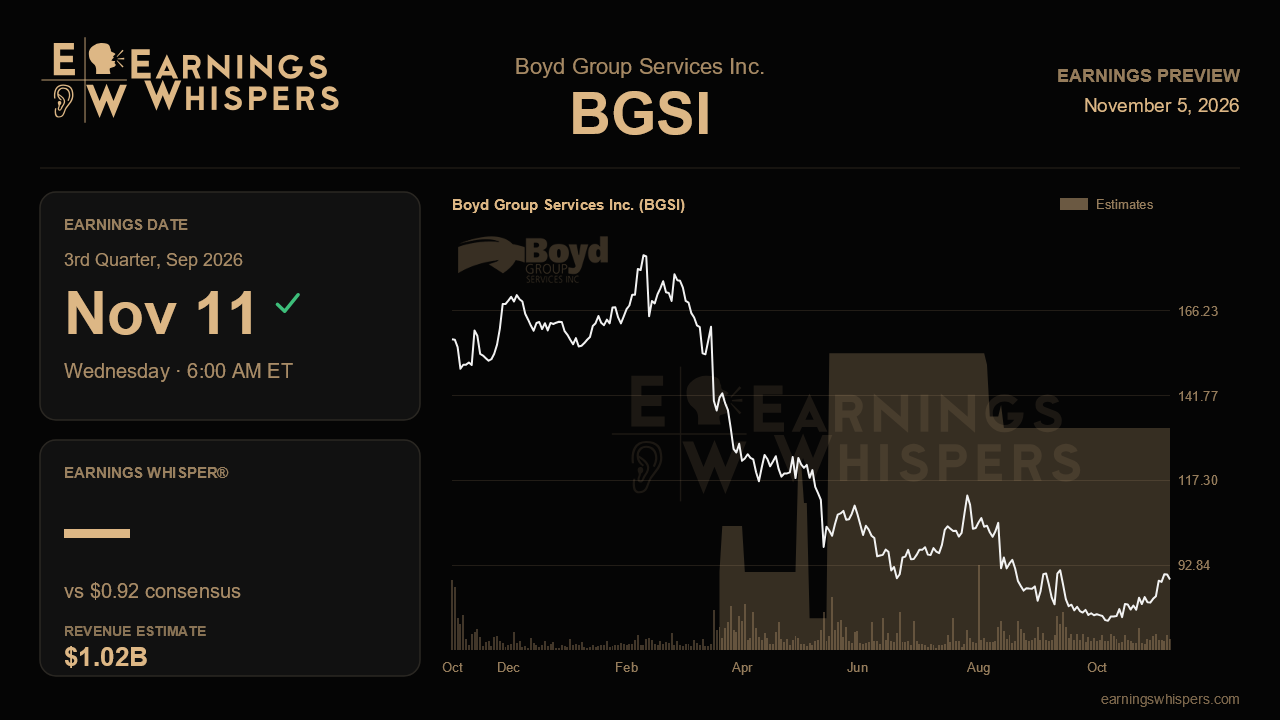
When Boyd reports before the open on November 11, consensus calls for earnings of $0.96 per share on revenue of about $1.02 billion. Against the year-ago quarter, those figures imply EPS growth of nearly 55% and revenue growth of about 29%, which is strong expansion by any measure. The sequential picture is more telling. Last quarter Boyd generated $1.01 billion in revenue and $0.80 in EPS, so analysts are effectively asking for about 1% more revenue to produce roughly 20% more earnings. Revenue of this scale has already been established, so the debate shifts to how efficiently each dollar of repair work converts into profit.
That makes operating leverage the central test. For a business built on a large network of repair centres, profitability depends on keeping technicians busy, managing parts and labor costs, and spreading fixed overhead across a bigger base. A year-over-year revenue jump from about $790 million to more than $1 billion means the company is carrying a substantially larger footprint than it was a year ago. The upcoming quarter should show whether that larger base is now generating the efficiencies that typically follow growth, or whether integration costs, labor expenses and pricing pressure are absorbing the benefit. With no updated management outlook to anchor the numbers, the Street's estimate is effectively its own judgment that margins are inflecting, and that judgment has not been formally endorsed by the company.
What would validate the bull case is straightforward: revenue at or modestly above $1.02 billion paired with gross and operating margins that clearly improve on last quarter, producing EPS near or above $0.96 without help from one-time items. A result that hits the revenue mark but lands closer to last quarter's $0.80 would suggest the cost structure is not scaling as hoped, and would likely raise questions about whether full-year earnings estimates are too aggressive. Commentary on repair volumes, labor availability and pricing with insurance partners will matter as much as the headline figures, since those drivers determine whether any margin gain is durable.
The market has not been generous in the meantime. Shares have fallen about 12% since the previous report, compared with a roughly 1% decline in the S&P 500, leaving the stock near $90 and well beneath its 200-day moving average of about $114. The post-earnings trading range has stretched from roughly $75 to $108, a lower and wider band than the prior quarter's $89 to $118, and the stock now sits closer to the middle of that range than either extreme. Sentiment remains bearish, though marginally less so than ahead of the last report, suggesting skepticism has eased only slightly rather than turned.
That combination creates a setup where the stock price already reflects meaningful doubt while the earnings estimate still assumes meaningful improvement. Ultimately, the report will turn on one question: can Boyd show that its expanded revenue base is now producing expanding profits? Clear evidence of margin progress would support the growth narrative and challenge the recent selling, while another quarter of flat profitability on flat sales would make the Street's earnings trajectory look harder to defend.
This earnings preview was originally published on Earnings Whispers.
This article is for informational purposes only and is not investment advice. Earnings Whispers and its staff may hold positions in the securities mentioned. It is AI-assisted, based on proprietary Earnings Whispers data and company reports, and edited by Earnings Whispers staff.
Mentioned In This Article
Latest News
| 6 hours | |
| 6 hours | |
| Nov-05 | |
| Oct-15 | |
| Sep-18 | |
| Sep-11 | |
| Aug-12 | |
| Aug-12 | |
| Jul-09 | |
| Jun-17 | |
| May-14 | |
| May-13 | |
| May-13 | |
| May-13 | |
| Apr-29 |
