What to Expect From Stocks After Midterms, Part 1
Subscribers to Chart of the Week received this commentary on Sunday, Nov. 8.
Election Day always takes the first week of November by storm. This week is no exception, with investors closely watching the midterms for a political shift in the attitudes toward tech and AI infrastructure. As investors monitor the fate of AI trade, we are taking a closer look at how the sector tends to perform after midterm voting. Below, we will dive into six- and 12-month returns for a handful of sectors and their typical performance following midterm elections.
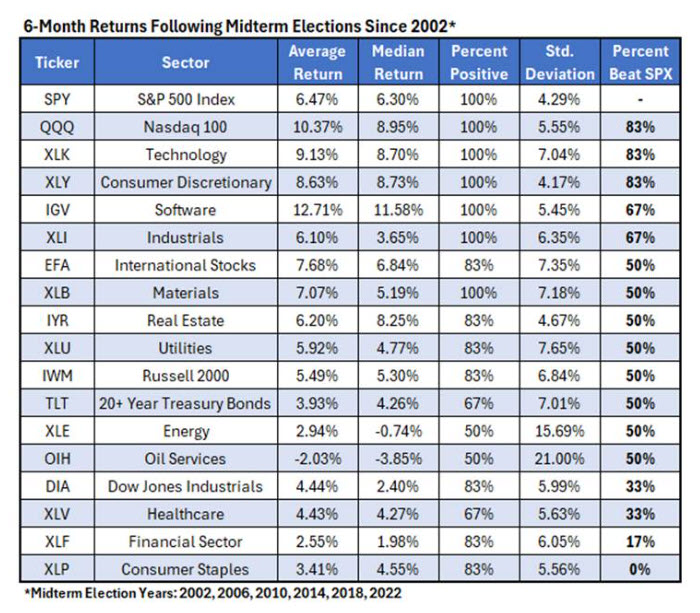
Per data from Schaeffer’s Senior Quantitative Analyst Rocky White, tech stocks tend to do well in the 12 months following midterms. Looking back at the six midterm elections since 2002, software (IGV), Invesco QQQ (QQQ), and technology (XLK) beat the SPX all six years over the next year. Oil services (OIH) is the only sector averaging a loss over the next year. Small caps underperform. Their 6.7% returns with 83% positive seems fine but it beat the S&P 500 Index (SPX) only one of the six years. The SPDR S&P 500 ETF Trust (SPY), meanwhile, was positive all six years with an average of 8.95%.
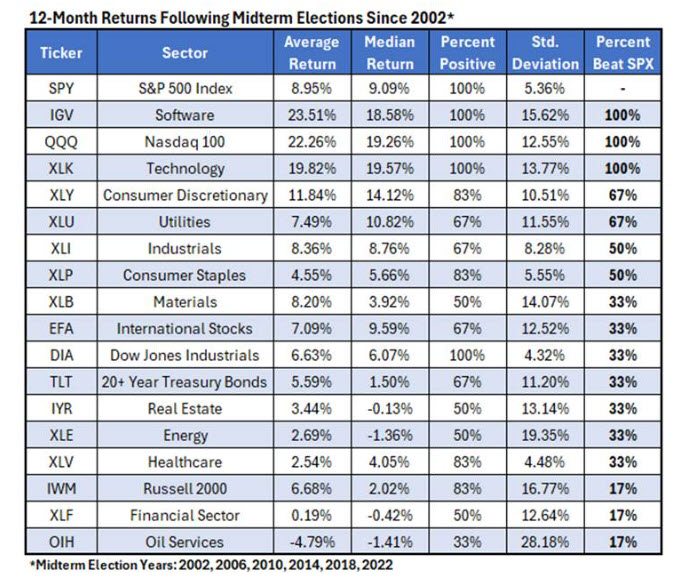
iShares Software ETF (IGV) is the best-performing ETF to own six months and one-year after midterm elections, looking back at data since 2002. Per White, IGV averaged a 12.7% return six months later, and finished higher all six times. Twelve months later, IGV was up on an average of 23.5%, and beat the S&P 500 every single time.
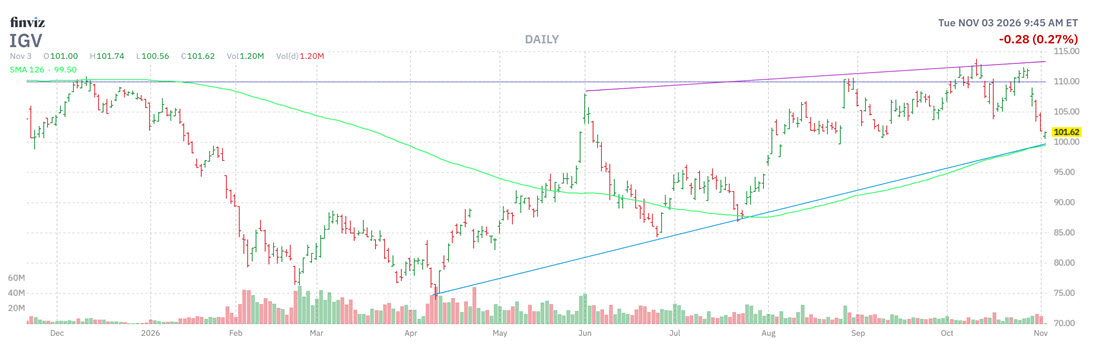
The technicals support a bounce back. Last week, IGV breached its year-to-date breakeven level as part of the broader tech rotation. The ETF pulled back to a trendline connecting higher lows, an area that coincides with not only round-number $100, but also the 126-day (half-year) moving average.
Options traders have been buying up puts. IGV’s Schaeffer's put/call open interest ratio (SOIR) of 2.95 stands in the 89th percentile of its annual range, so an unwinding of these bearish bets could provide a boost for the ETF.
Double clicking on IGV for a moment, cybersecurity firm Palo Alto Networks (PANW) is the ETF’s largest holding. The shares of PANW are 17% off their Oct. 6 record peak of $432.32. However, there’s support at the 100-day moving average, as well as an uptrend channel from the August peak. If the AI infrastructure washout runs out of steam in the next few months, investors could be looking to snap up companies like Palo Alto Networks that handle the cybersecurity side of AI.
Another sector that has performed well is Consumer Discretionary (XLY). Over the past decade, XLY has averaged an 8.6% return six months later, and 11.8% return 12 months later. These returns boast win rates of 100% and 83%, respectively, indicating a solid rate of upbeat returns for no fewer than 12 months out.
The current options skew is set up to unwind, should there be more outperformance. The ETF’s gamma-weighted SOIR of 1.35, broader sentiment suggests plenty of room for an unwinding of pessimism.
Echoing this, at the International Securities Exchange (ISE), Cboe Options Exchange (CBOE), and Nasdaq OMX PHLX (PHLX), XLP’s 50-day put/call volume ratio comes in at 5.47. In other words, five puts have been purchased for every call over the past 10 weeks. Should investors begin to shake off this bearish attention, it could trigger tailwinds for XLY.
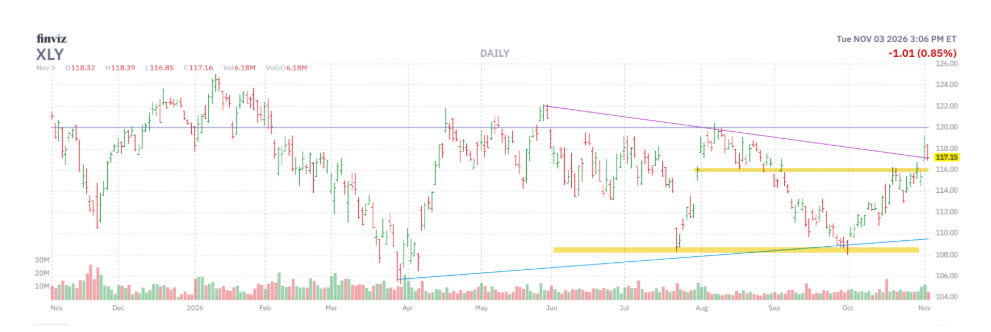
XLY recently gapped above the $116 level for the first time since early September. Aided by a long-term trendline connecting the ETF’s late-March 52-week low to its October bottom, the fund is now pressuring its year-to-date level. The $108 level also acted as a bouncing off point for the shares both in July and early October.
Mentioned In This Article
Latest News
| 3 hours | |
| Nov-09 | |
| Nov-04 | |
| Nov-02 | |
| Oct-29 | |
| Oct-28 | |
| Oct-26 | |
| Oct-22 | |
| Oct-22 | |
| Oct-20 | |
| Oct-19 | |
| Oct-17 | |
| Oct-16 | |
| Oct-15 | |
| Oct-13 |
