Historic Stock Market Trends During Thanksgiving Week
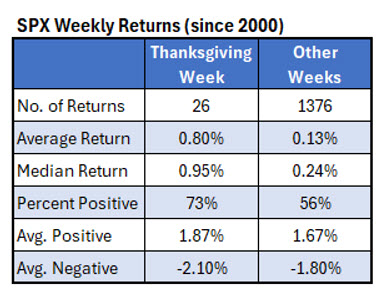
Thanksgiving is next week, meaning a three-and-a-half day trading week with markets closed Thursday and then a shortened trading session on Friday. Since 2000, the holiday week has been a bullish for stocks, with the SPX averaging a 0.80% return and 73% of the returns positive. Compare that to the typical weekly return for the index of 0.13% with 56% of the returns positive.
Interestingly, Thanksgiving has produced larger-than-normal moves in both directions. The average positive and average negative return for the week has been bigger in magnitude compared to other weeks. Thanksgiving week is often described as quiet, but I guess that refers to volumes and not directional movement (more on this later).
In this week’s article, I’ll reveal which days mostly contribute to the bullish weekly returns, I’ll look at how options have performed during the holiday-shortened week, and I’ll see which stocks have historically been the best and worst performers.
Days of the Week
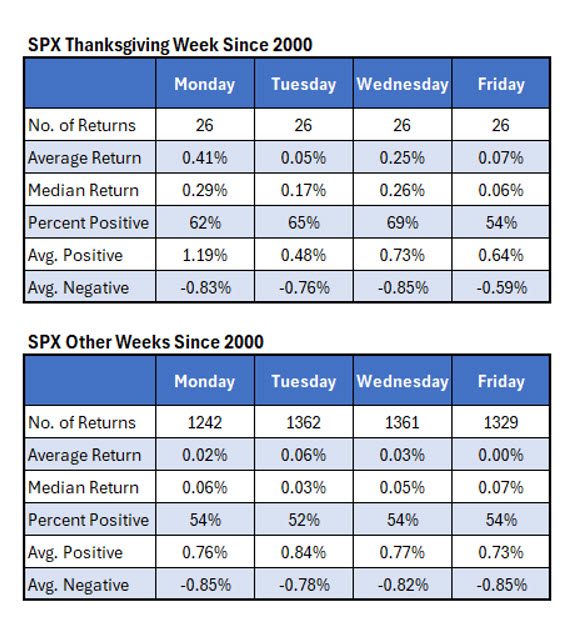
The table below breaks down Thanksgiving week by day. Since 2000, it tended to get off to a fast start. Monday has been the best day of the week with the SPX averaging a return of 0.41% and 62% of the returns positive. Monday has also shown a lot of upside as measured by the average positive return of about 1.2%. Wednesday has also been strong, averaging a return of 0.25% and almost 70% of the returns positive.
The gains during Thanksgiving week have tended to occur Monday to Wednesday, before the holiday. Friday has tended to be positive but not spectacular.
Underpriced Options?
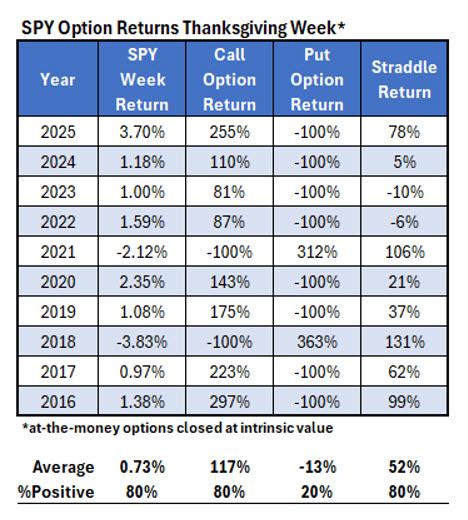
For this next table, I’m using data for the SPDR S&P 500 ETF Trust (SPY), due to its extremely liquid options. I have weekly option data on the ETF going back to 2016. The table below shows the return of the SPY and its at-the-money weekly options assuming they were purchased at the close on the Friday before Thanksgiving and closed at intrinsic value the day after Thanksgiving.
Options have been underpriced Thanksgiving week over the past 10 years. A weekly straddle expiring the day after Thanksgiving would have averaged a return of 52% with eight of 10 returns positive. Purchasing a call option for Thanksgiving week over the past 10 years would have averaged a return of 117%. Put options were only positive two of the 10 years, but in the two years puts were positive, they returned more than 300%.
One theory is that options are mispriced Thanksgiving week due to its reputation as being a quiet week and the fact there’s just three and a half days of trading. Investors may expect less directional movement during the week. Just like any week, however, there are still seven days of news and information that needs to be absorbed. The option data in the table supports this theory. On the other hand, it’s just 10 data points and could be random.
Notable Stocks During Thanksgiving Week
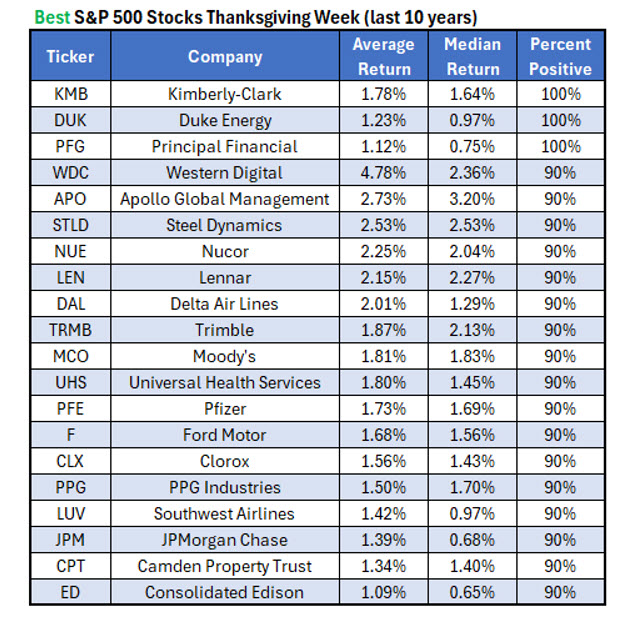
Below is a list of individual S&P 500 stocks that have performed the best during the week of Thanksgiving over the past 10 years. It’s sorted first by percent positive and then by average return. Three stocks have been positive all 10 times: Kimberly-Clark (KMB), Duke Energy (DUK), and Principal Financial (PFG).
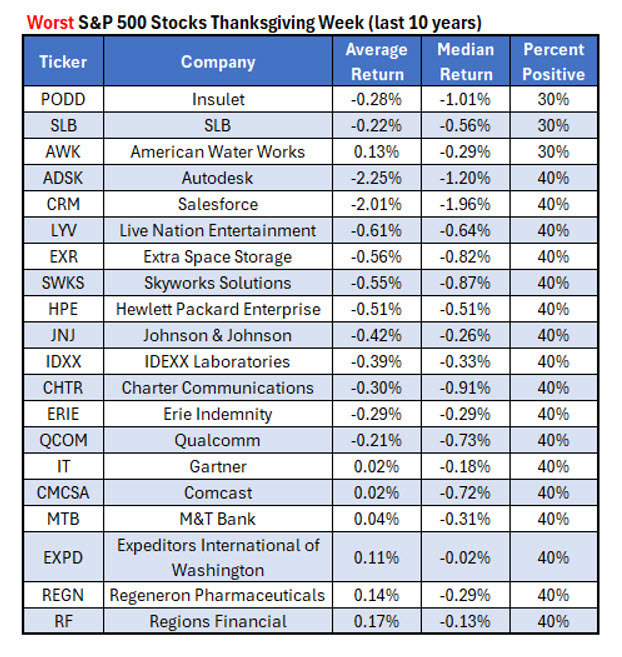
Finally, here is the list of stocks which have performed the worst during Thanksgiving week over the past 10 years.
Mentioned In This Article
Latest News
| 45 min | |
| 1 hour | |
| 7 hours | |
| Nov-17 | |
| Nov-16 | |
| Nov-16 | |
| Nov-16 | |
| Nov-16 | |
| Nov-15 | |
| Nov-13 | |
| Nov-13 | |
| Nov-13 | |
| Nov-13 | |
| Nov-12 | |
| Nov-12 |
