SunPower Needs A Sharp Revenue Rebound To Answer A Stock Trading Near A Dime
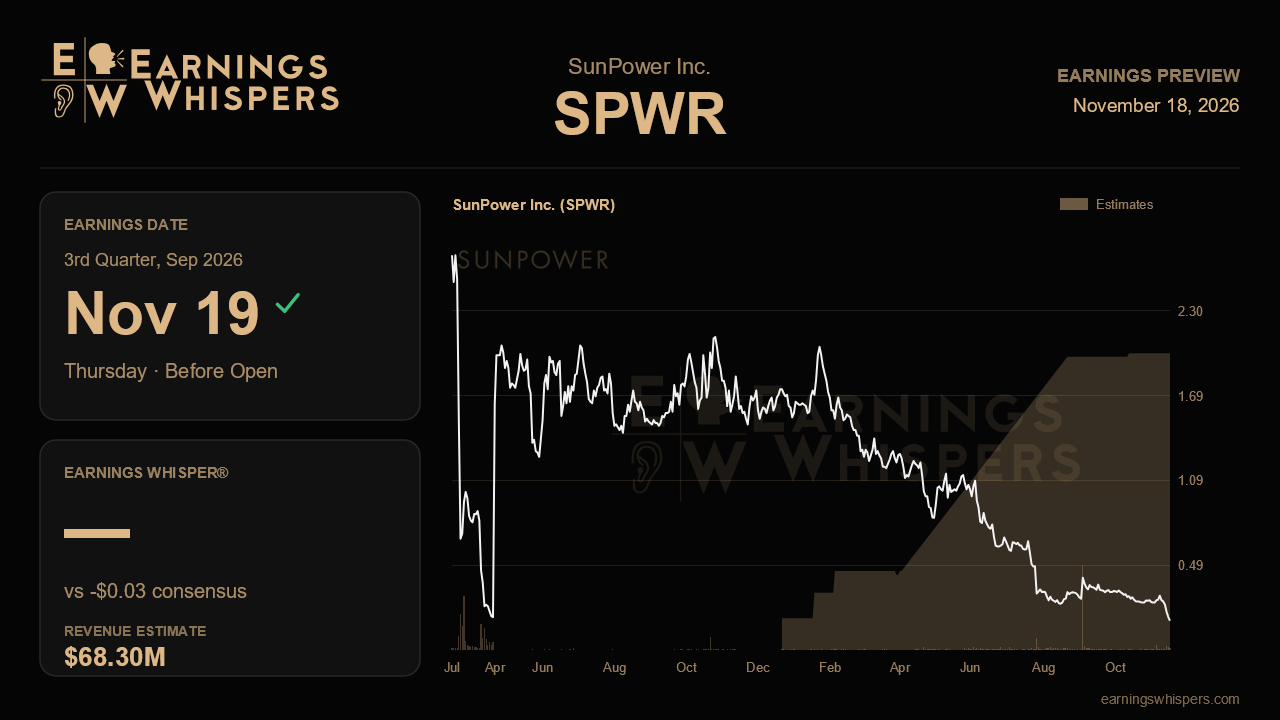
SunPower heads into its September-quarter report with a striking disconnect between what analysts are modeling and what the stock market is pricing. Wall Street expects a meaningful sequential sales rebound and a loss of only a few cents per share. Meanwhile, the shares have collapsed to roughly ten cents, down nearly 64% since the last report. When a stock falls that far while forecasts still call for near-breakeven results, the release has to show that the business can carry those numbers.
The consensus calls for a loss of $0.03 per share on revenue of about $68.3 million. On a year-over-year basis, that would be a big improvement in profitability: the company lost $0.19 per share in the same quarter last year, so the expected loss is about 84% smaller. Revenue, however, is projected to slip about 2.4% from $70.0 million a year ago. The more demanding comparison is sequential. Last quarter SunPower posted $54.9 million in sales and roughly breakeven earnings per share, so analysts are looking for top-line growth of about 24% from one quarter to the next. Even with that jump, they still expect a slightly worse bottom line than the breakeven figure just reported.
That combination frames the key questions. A residential solar installer with a digital sales platform lives or dies on installation volume, pricing and the cost of acquiring each customer. A sales recovery to the high $60 million range would suggest projects are moving through the pipeline again. If that rebound comes without a matching improvement in earnings, though, it would raise doubts about margins or operating expenses. No fresh management guidance is on the table to anchor the forecast, so the Street's estimate is the main benchmark. The quarterly release and commentary will need to do the heavy lifting on whether last quarter's breakeven result reflected durable cost discipline or a one-time benefit.
What would validate the bullish case is straightforward. Revenue should land at or above the $68 million mark, gross margins should hold steady as volume returns, and operating costs should stay contained so that profitability improves rather than erodes. What would challenge it is just as clear. Another quarter of revenue in the mid-$50 million range would make the year-ago comparison look far worse than modeled. A wider-than-expected loss would undercut the idea that the company has fixed its cost structure. For a stock at this price, investors will also want any detail on cash, liquidity and funding needs, since a sub-dollar share price narrows a company's financing options.
Sentiment has turned noticeably more optimistic, with bullish readings climbing to about 63% from roughly 48% heading into the prior report. That shift sits awkwardly beside the price action. The stock trades well below its 200-day moving average near $0.76 and sits close to the $0.08 low of its post-earnings range, far beneath the $0.46 high. The previous quarter's range of $0.20 to $1.19 shows how quickly value has drained away. The market has punished the shares far more harshly than the S&P 500's modest 4.4% decline, trailing the index by almost 60 percentage points. Some traders appear to be positioning for a rebound, but the tape has offered no confirmation.
Ultimately, this report hinges on whether SunPower can deliver the sequential revenue recovery analysts are counting on while keeping losses near breakeven. If sales rebound and costs stay in check, the gap between the fundamentals and a ten-cent stock could become a real debate. If revenue stalls again or losses widen, the market's verdict will look justified, and attention will shift squarely to the balance sheet.
This earnings preview was originally published on Earnings Whispers.
This article is for informational purposes only and is not investment advice. Earnings Whispers and its staff may hold positions in the securities mentioned. It is AI-assisted, based on proprietary Earnings Whispers data and company reports, and edited by Earnings Whispers staff.
Mentioned In This Article
Latest News
| 51 min | |
| 2 hours | |
| Nov-18 | |
| Nov-17 | |
| Nov-16 | |
| Oct-27 | |
| Oct-08 | |
| Oct-06 | |
| Sep-04 | |
| Sep-03 | |
| Jul-28 | |
| Jul-28 | |
| Jul-28 | |
| Jul-27 | |
| Jul-20 |
