|
|
|

|
|||||
|
|
|
Chubb Limited CB has been trading above its 200-day simple moving average (SMA), signaling a short-term bullish trend. Its share price, as of June 11, 2025, was $285.61, down 6.9% from its 52-week high of $306.91.
The 200-day SMA is a key indicator for traders and analysts to identify support and resistance levels. It is considered particularly important as this is the first marker of an uptrend or downtrend.
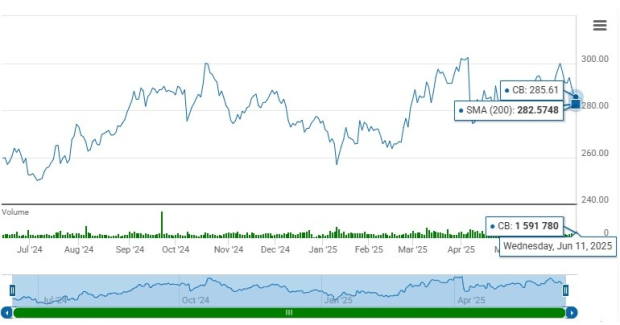
With a market capitalization of $114.45 billion, the average volume of shares traded in the last three months was 1.7 million.
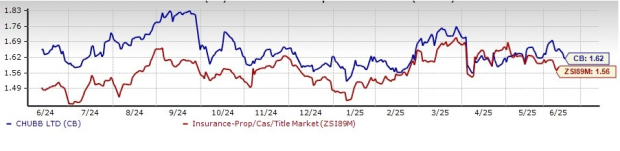
The insurer’s shares are trading at a price-to-book value of 1.62, higher than the industry average of 1.56. Also, it has a Value Score of B. Chubb is, however, cheaper compared with Palomar Holdings, Inc. PLMR, Arch Capital Group Ltd. ACGL and The Travelers Companies, Inc. TRV.
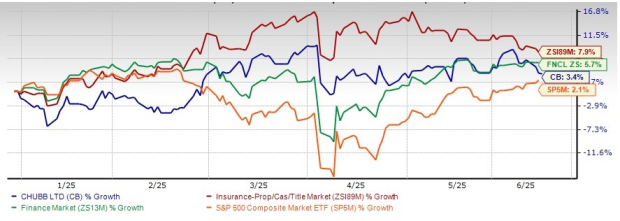
Shares of Chubb have gained 3.4% in the year-to-date (YTD) period, underperforming the industry’s growth of 7.9% and the Finance sector’s return of 5.7%. It, however, outperformed the S&P 500 composite’s return of 2.1% in the YTD period.
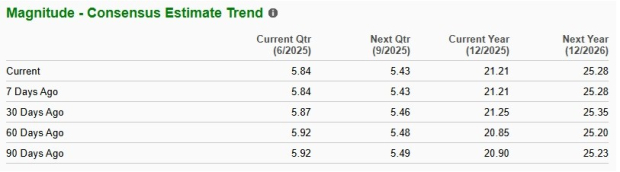
The Zacks Consensus Estimate for Chubb’s 2025 revenues is pegged at $59.74 billion, implying a year-over-year improvement of 6.2%. The consensus estimate for 2026 earnings per share and revenues indicates an increase of 19.1% and 6.6%, respectively, from the corresponding 2025 estimates.
Nine of the 11 analysts covering the stock have raised estimates for 2025 and 2026 over the past 60 days. Thus, the Zacks Consensus Estimate for 2025 earnings has moved up 1.7% in the past 60 days, and for 2026, the same has moved north 0.3% in the same time frame.
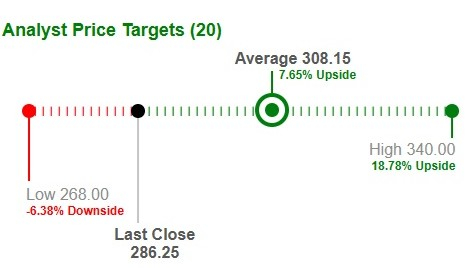
Based on short-term price targets offered by 20 analysts, the Zacks average price target is $308.15 per share. The average indicates a potential 7.6% upside from the last closing price.
Chubb’s bottom line surpassed earnings estimates in each of the last four quarters, the average being 11.48%.
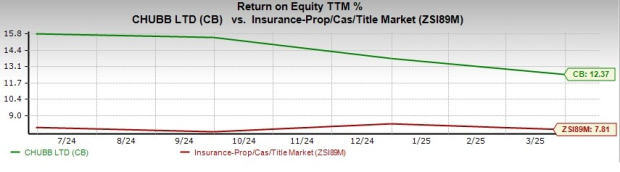
Return on equity in the trailing 12 months was 12.3%, better than the industry average of 7.8%. Return on equity, a profitability measure, reflects how effectively a company is utilizing its shareholders.
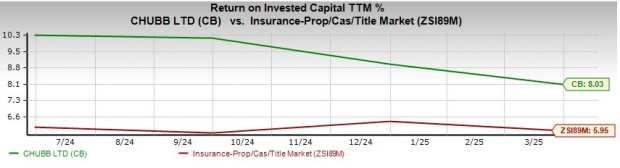
Also, return on invested capital (ROIC) has been increasing over the last few quarters amid capital investments made over the same time frame. This reflects CB’s efficiency in utilizing funds to generate income. ROIC in the trailing 12 months was 8%, better than the industry average of 5.95%.
Chubb remains focused on capitalizing on the potential of middle-market businesses (both domestic and international) as well as enhancing traditional core packages and specialty products for long-term growth. In its efforts to accelerate growth, Chubb is also making strategic investments in various initiatives.
Chubb pursues strategic mergers and acquisitions to diversify its portfolio, add capabilities and synergies, and expand its geographic footprint. Recently, Chubb agreed to acquire the insurance businesses of Liberty Mutual in Thailand and Vietnam. Acquisitions have also improved premium revenues. Premiums should also benefit from commercial P&C rate increases, new business and strong renewal retention. An impressive inorganic growth story helps to achieve a higher long-term return on equity.
Though the Fed has started lowering the interest rate, investment income should benefit from improving operating cash flow. Chubb expects the quarterly adjusted net investment income to have a run rate between $1.67 billion and $1.75 billion over the next six months.
Chubb has a strong capital position and sufficient cash-generation capabilities, which support wealth distribution to shareholders and growth initiatives.
Being a P&C insurer, CB is exposed to catastrophe events, which induce volatility in underwriting profitability and affect the combined ratio. Given the uncertainty surrounding the magnitude of cat loss, higher losses could drain earnings.
Also, Chubb’s leverage and times interest earned compare unfavorably with the industry.
Chubb’s market-leading position, compelling portfolio, strong renewal retention, positive rate increases, solid capital position and better return on capital pave the way for long-term growth.
The insurer’s dividend history is impressive. It has increased dividends for 31 straight years and is set to hike them again this year by 6.5%. CB has a dividend yield of 1.27%, better than the industry average of 0.2%.
However, given its premium valuation and unfavorable leverage and times interest earned, we prefer to stay cautious on this Zacks Rank #3 (Hold) stock. You can see the complete list of today’s Zacks #1 Rank (Strong Buy) stocks here.
Want the latest recommendations from Zacks Investment Research? Today, you can download 7 Best Stocks for the Next 30 Days. Click to get this free report
This article originally published on Zacks Investment Research (zacks.com).
| 3 hours | |
| Mar-31 | |
| Mar-30 | |
| Mar-26 | |
| Mar-25 | |
| Mar-25 | |
| Mar-25 | |
| Mar-25 | |
| Mar-24 | |
| Mar-24 | |
| Mar-20 | |
| Mar-17 | |
| Mar-13 | |
| Mar-12 | |
| Mar-12 |
Join thousands of traders who make more informed decisions with our premium features. Real-time quotes, advanced visualizations, alerts, and much more.
Learn more about Finviz Elite