|
|
|

|
|||||
|
|
|

Food processing and aviation equipment manufacturer John Bean (NYSE:JBT) beat Wall Street’s revenue expectations in Q2 CY2025, with sales up 132% year on year to $934.8 million. The company’s full-year revenue guidance of $3.7 billion at the midpoint came in 1.3% above analysts’ estimates. Its non-GAAP profit of $1.49 per share was 16.4% above analysts’ consensus estimates.
Is now the time to buy John Bean? Find out by accessing our full research report, it’s free.
"We are pleased with our second quarter results, which exceeded our guidance, reflecting our ability to navigate a dynamic operating environment and manage the integration of two global businesses," said Brian Deck, Chief Executive Officer.
Tracing back to its invention of the mechanical milk bottle filler in 1884, John Bean (NYSE:JBT) designs, manufactures, and sells equipment used for food processing and aviation.
A company’s long-term sales performance can indicate its overall quality. Even a bad business can shine for one or two quarters, but a top-tier one grows for years. Regrettably, John Bean’s sales grew at a mediocre 7.3% compounded annual growth rate over the last five years. This was below our standard for the industrials sector and is a poor baseline for our analysis.
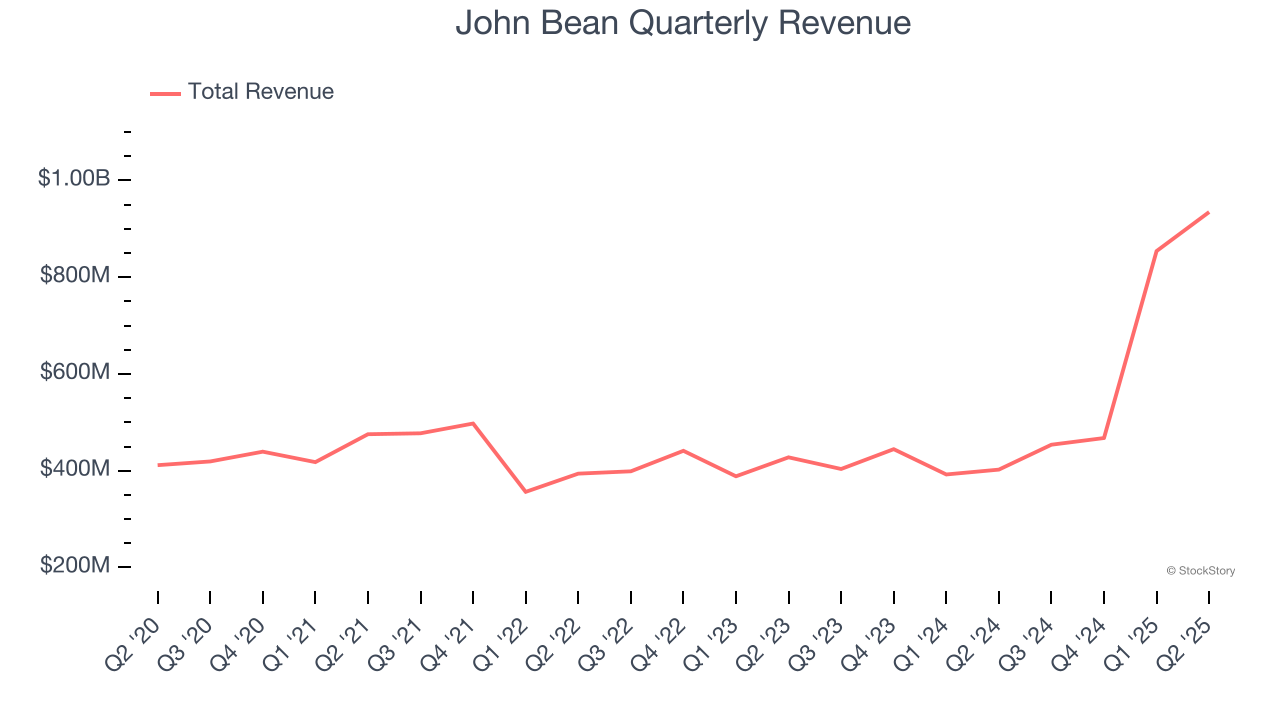
We at StockStory place the most emphasis on long-term growth, but within industrials, a half-decade historical view may miss cycles, industry trends, or a company capitalizing on catalysts such as a new contract win or a successful product line. John Bean’s annualized revenue growth of 27.9% over the last two years is above its five-year trend, suggesting its demand recently accelerated.
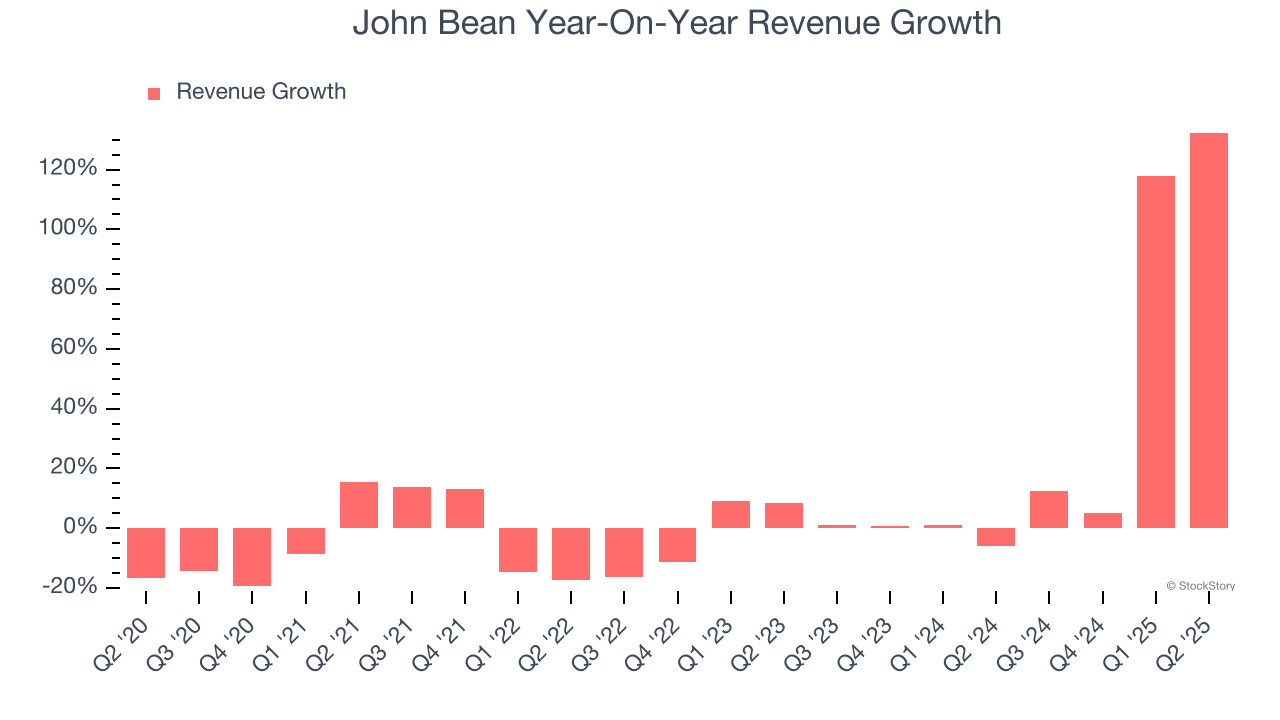
This quarter, John Bean reported magnificent year-on-year revenue growth of 132%, and its $934.8 million of revenue beat Wall Street’s estimates by 4.9%.
Looking ahead, sell-side analysts expect revenue to grow 37.8% over the next 12 months, an improvement versus the last two years. This projection is eye-popping and suggests its newer products and services will fuel better top-line performance.
Here at StockStory, we certainly understand the potential of thematic investing. Diverse winners from Microsoft (MSFT) to Alphabet (GOOG), Coca-Cola (KO) to Monster Beverage (MNST) could all have been identified as promising growth stories with a megatrend driving the growth. So, in that spirit, we’ve identified a relatively under-the-radar profitable growth stock benefiting from the rise of AI, available to you FREE via this link.
John Bean was profitable over the last five years but held back by its large cost base. Its average operating margin of 7% was weak for an industrials business. This result is surprising given its high gross margin as a starting point.
Analyzing the trend in its profitability, John Bean’s operating margin decreased by 6.1 percentage points over the last five years. This raises questions about the company’s expense base because its revenue growth should have given it leverage on its fixed costs, resulting in better economies of scale and profitability. John Bean’s performance was poor no matter how you look at it - it shows that costs were rising and it couldn’t pass them onto its customers.
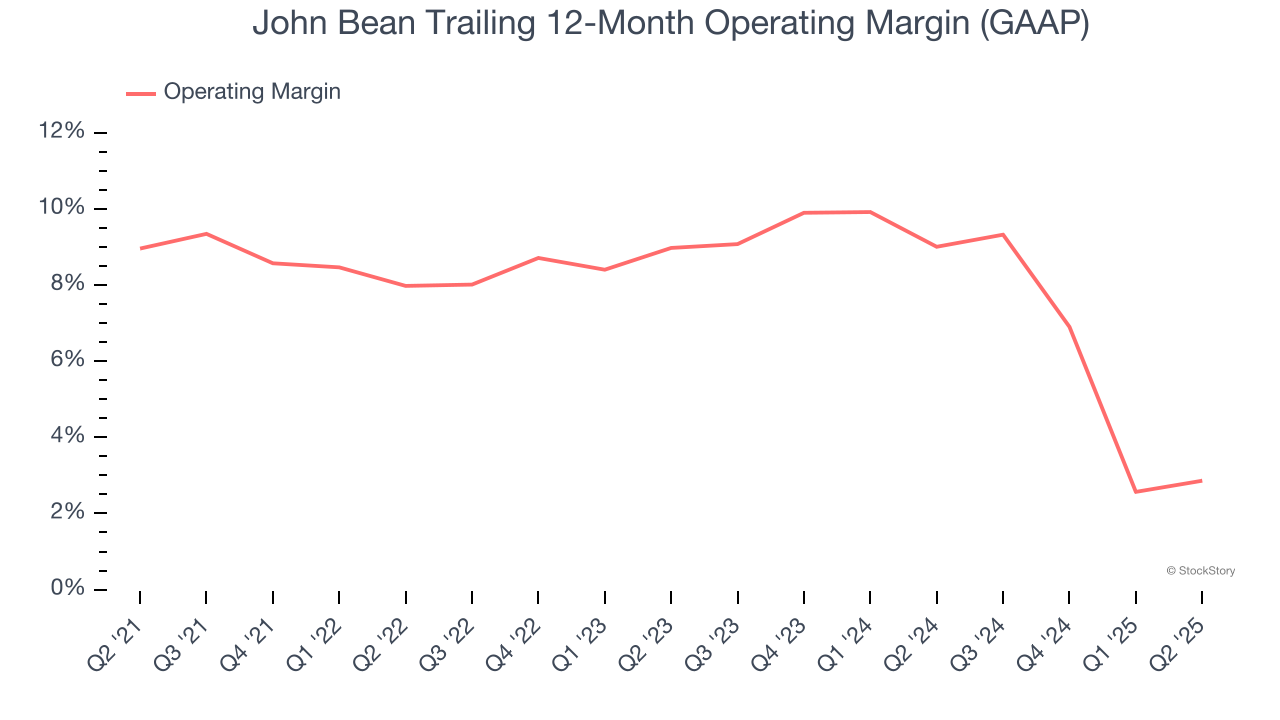
In Q2, John Bean generated an operating margin profit margin of 5.2%, down 1.5 percentage points year on year. Since John Bean’s operating margin decreased more than its gross margin, we can assume it was less efficient because expenses such as marketing, R&D, and administrative overhead increased.
Revenue trends explain a company’s historical growth, but the long-term change in earnings per share (EPS) points to the profitability of that growth – for example, a company could inflate its sales through excessive spending on advertising and promotions.
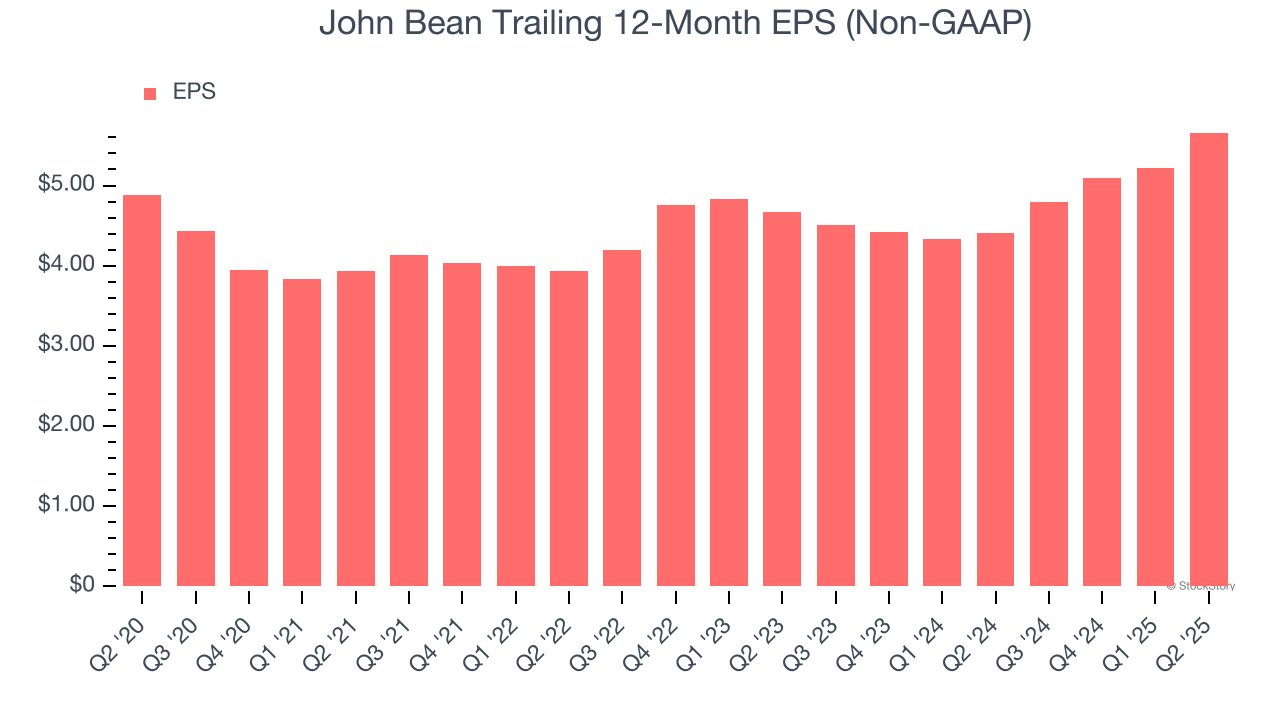
John Bean’s EPS grew at a weak 3% compounded annual growth rate over the last five years, lower than its 7.3% annualized revenue growth. This tells us the company became less profitable on a per-share basis as it expanded.
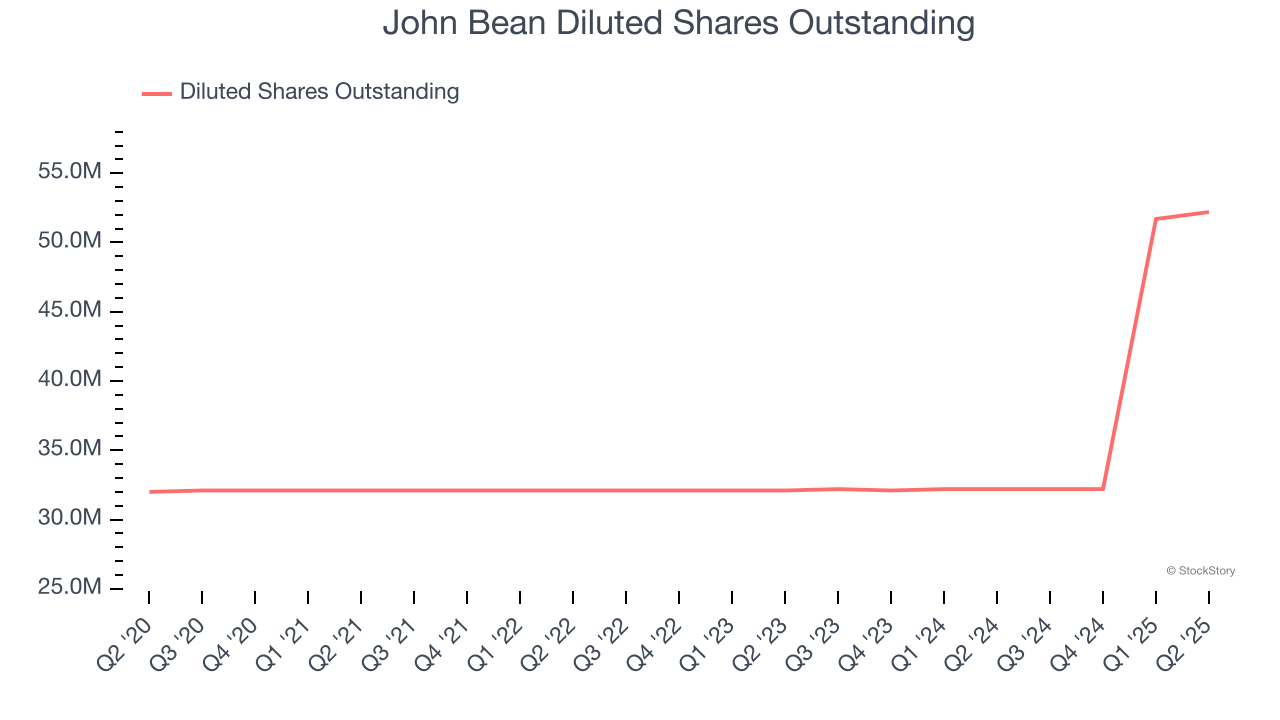
Diving into the nuances of John Bean’s earnings can give us a better understanding of its performance. As we mentioned earlier, John Bean’s operating margin declined by 6.1 percentage points over the last five years. Its share count also grew by 63.1%, meaning the company not only became less efficient with its operating expenses but also diluted its shareholders.
Like with revenue, we analyze EPS over a shorter period to see if we are missing a change in the business.
For John Bean, its two-year annual EPS growth of 10.1% was higher than its five-year trend. This acceleration made it one of the faster-growing industrials companies in recent history.
In Q2, John Bean reported adjusted EPS at $1.49, up from $1.05 in the same quarter last year. This print easily cleared analysts’ estimates, and shareholders should be content with the results. Over the next 12 months, Wall Street expects John Bean’s full-year EPS of $5.66 to grow 18.3%.
We were impressed by how significantly John Bean blew past analysts’ EBITDA expectations this quarter. We were also excited its revenue outperformed Wall Street’s estimates by a wide margin. Zooming out, we think this was a solid print. The stock traded up 3% to $137.60 immediately after reporting.
John Bean may have had a good quarter, but does that mean you should invest right now? The latest quarter does matter, but not nearly as much as longer-term fundamentals and valuation, when deciding if the stock is a buy. We cover that in our actionable full research report which you can read here, it’s free.
| Jul-14 | |
| Jul-07 | |
| May-14 | |
| May-07 | |
| May-07 | |
| May-05 | |
| May-04 | |
| May-04 | |
| May-04 | |
| May-01 | |
| Apr-20 | |
| Mar-26 | |
| Mar-11 | |
| Mar-10 | |
| Mar-04 |
Join thousands of traders who make more informed decisions with our premium features. Real-time quotes, advanced visualizations, alerts, and much more.
Learn more about Finviz Elite