|
|
|

|
|||||
|
|
|
Hanesbrands Inc. (HBI) reported second-quarter 2025 results, wherein both top and bottom lines beat the Zacks Consensus Estimate and increased year over year.
The company posted adjusted earnings from continuing operations of 24 cents per share, beating the Zacks Consensus Estimate of 18 cents. The metric increased from 15 cents per share in the year-ago quarter.

Hanesbrands Inc. price-consensus-eps-surprise-chart | Hanesbrands Inc. Quote
Net sales from continuing operations increased 1.8% year over year to $991.3 million and beat the Zacks Consensus Estimate of $970 million. On a constant-currency basis, organic net sales were consistent with the prior year.
Adjusted gross profit was $408 million, up 6% year over year. The adjusted gross margin was 41.2%, up nearly 145 basis points (bps). Gross profit and the gross margin rose year over year due to cost-saving and productivity initiatives, benefits from assortment management and reduced input costs.
Selling, general and administrative (SG&A) costs were $257.3 million, down 28.8% year over year. As a percentage of net sales, SG&A costs decreased to 26% down from 37.1% in the prior-year quarter. The decline reflects successful cost-saving measures and disciplined expense management.
Adjusted operating profit was $153 million, up 22% year over year. Adjusted operating margin was 15.5%, up 255 bps. The improvement was driven by a combination of higher gross margin and lower SG&A expenses.
U.S. Segment: The segment’s net sales decreased 0.6% year over year to $735.5 million. The company remained focused on core growth drivers, including innovation, brand investments and incremental programming opportunities. These efforts supported year-over-year growth in the Basics, Active and New businesses. However, consistent with broader innerwear market trends, this growth was more than offset by continued softness in the Intimate Apparel category.
The segmental operating margin was 25%, up almost 360 bps. This improvement was mainly fueled by cost-saving, productivity initiatives and lower input costs.
International Segment: International net sales decreased 3.1% on a reported basis to $226 million, which included a $7 million headwind from unfavorable foreign exchange rates and were flat with the prior year on a constant currency basis. By region, constant currency net sales increased in the Americas, remained flat in Australia and declined in Asia.
The operating margin of 10.7% decreased 225 bps from the prior year, impacted by increased promotional activity, unfavorable product mix, higher brand investment and foreign exchange pressures. These factors more than offset the benefits from cost-saving measures and lower input costs.
The Zacks Consensus Estimate of net sales of the U.S. and International segments was pegged at $733 million and $228 million, respectively, for the quarter under review.
This Zacks Rank #3 (Hold) company ended the quarter with cash and cash equivalents of $220.3 million, long-term debt of $2.27 billion and total stockholders’ equity of $166.4 million.
In the quarter, the company provided $36.3 million in net cash from operating activities. The free cash flow was $27.2 million in the second quarter.
For the third quarter of 2025, the company expects net sales from continuing operations of $900 million, including a $7 million foreign currency exchange rate headwind. This is consistent with the prior-year quarter on both a reported and organic constant-currency basis.
Operating profit from continuing operations is estimated at $116 million. Adjusted operating profit is expected to be $122 million, excluding $6 million in restructuring and action-related pretax charges. The operating profit outlook includes a predicted $1 million foreign currency headwind. Earnings per share from continuing operations are pegged at 14 cents, while adjusted earnings from continuing operations are pinned at 16 cents.
For 2025, the company expects net sales from continuing operations of $3.53 billion, which includes an estimated $35 million headwind from foreign currency exchange rates. Net sales are predicted to increase slightly year over year on both a reported and organic constant currency basis.
Operating profit from continuing operations is now expected to be approximately $471 million, up from the previous guided range of $425-$440 million. Adjusted operating profit is anticipated to be approximately $485 million, excluding estimated restructuring and action-related pretax charges of $14 million. The operating profit outlook includes a predicted $5 million foreign currency headwind.
Earnings per share from continuing operations are now estimated to be approximately 59 cents compared with the prior outlook of 42-46 cents. Adjusted earnings per share are estimated at approximately 66 cents, up from the previous guidance of 51-55 cents.
The company anticipates $350 million in cash flow from operations and capital investments of $65 million, including $50 million in capital expenditure and $15 million in cloud computing arrangements. The free cash flow is expected to be $300 million.
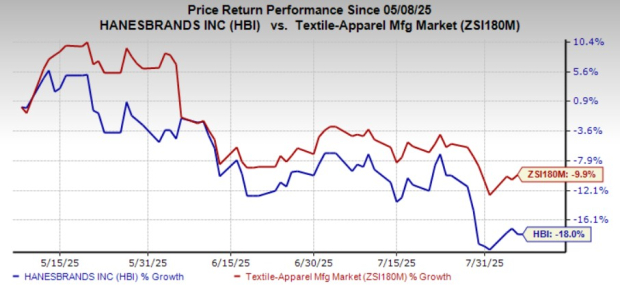
HBI’s shares have lost 18% in the past three months compared with the industry’s 9.9% decline.
Ralph Lauren Corporation (RL) designs, markets and distributes lifestyle products in North America, Europe, Asia and internationally. It currently carries a Zacks Rank #2 (Buy). You can see the complete list of today’s Zacks #1 Rank (Strong Buy) stocks here.
The Zacks Consensus Estimate for RL’s current fiscal-year sales and earnings indicates growth of 4.1% and 13.1%, respectively, from the year-ago reported figures. Ralph Lauren delivered a trailing four-quarter average earnings surprise of 9%.
Revolve Group, Inc. (RVLV) operates as an online fashion retailer for millennial and Generation Z consumers in the United States and internationally. It carries a Zacks Rank of 2 at present. Revolve Group delivered a trailing four-quarter average earnings surprise of 48.8%.
The Zacks Consensus Estimate for RVLV’s current fiscal-year revenues implies growth of 6.8% from the year-ago actuals.
Savers Value Village, Inc. (SVV) sells second-hand merchandise in retail stores in the United States, Canada and Australia. It has a Zacks Rank of 2 at present. SVV delivered an earnings surprise of 22.1% in the trailing four quarters, on average.
The Zacks Consensus Estimate for Savers Value Village’s current fiscal-year sales indicates growth of 9.1% from the year-ago reported figures.
Want the latest recommendations from Zacks Investment Research? Today, you can download 7 Best Stocks for the Next 30 Days. Click to get this free report
This article originally published on Zacks Investment Research (zacks.com).
| Jun-12 | |
| Jun-11 | |
| Jun-09 | |
| Jun-09 | |
| Jun-09 | |
| Jun-04 | |
| Jun-04 | |
| Jun-04 | |
| Jun-01 | |
| May-29 | |
| May-29 | |
| May-24 | |
| May-22 | |
| May-22 | |
| May-22 |
Join thousands of traders who make more informed decisions with our premium features. Real-time quotes, advanced visualizations, alerts, and much more.
Learn more about Finviz Elite