|
|
|

|
|||||
|
|
|

Pharmaceutical company Amphastar Pharmaceuticals (NASDAQAMPH) fell short of the market’s revenue expectations in Q2 CY2025, with sales falling 4.4% year on year to $174.4 million. Its non-GAAP profit of $0.85 per share was 14.6% above analysts’ consensus estimates.
Is now the time to buy Amphastar Pharmaceuticals? Find out by accessing our full research report, it’s free.
Founded in 1996 and known for its expertise in complex drug formulations, Amphastar Pharmaceuticals (NASDAQ:AMPH) develops and manufactures technically challenging injectable and inhalation medications, including both generic and proprietary pharmaceutical products.
Examining a company’s long-term performance can provide clues about its quality. Any business can put up a good quarter or two, but the best consistently grow over the long haul. Thankfully, Amphastar Pharmaceuticals’s 16.7% annualized revenue growth over the last five years was impressive. Its growth beat the average healthcare company and shows its offerings resonate with customers.
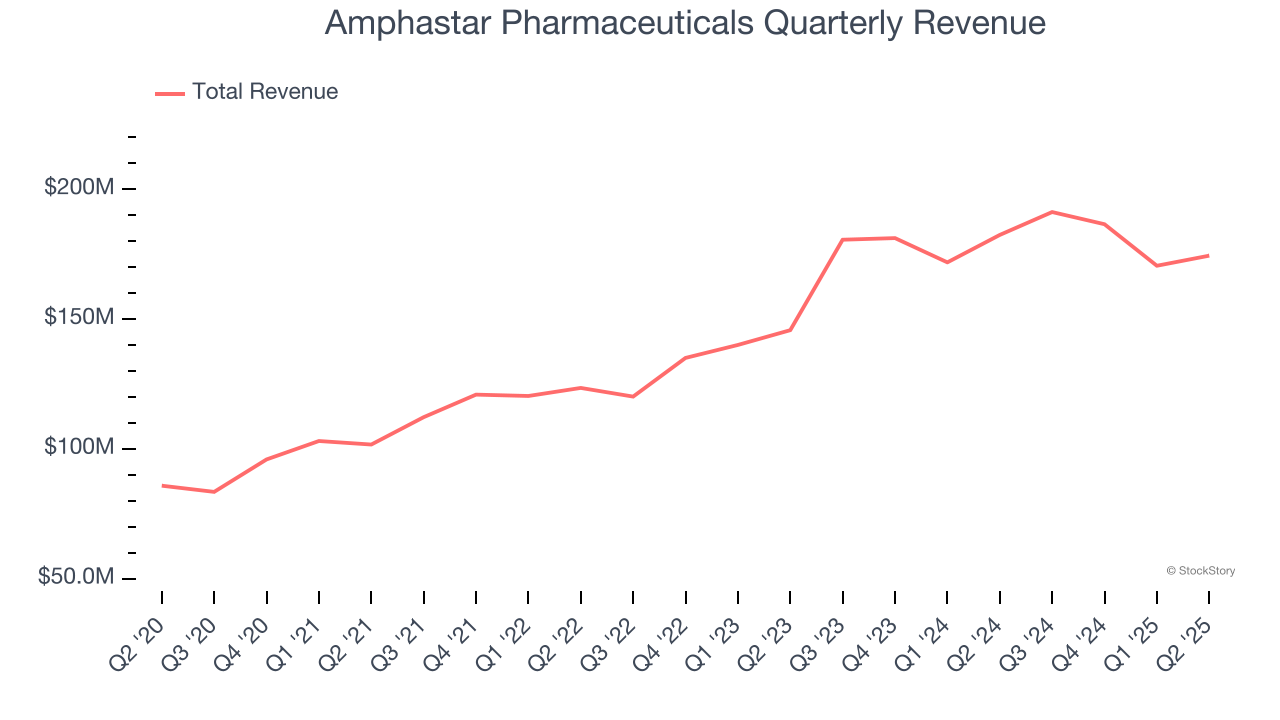
Long-term growth is the most important, but within healthcare, a half-decade historical view may miss new innovations or demand cycles. Amphastar Pharmaceuticals’s annualized revenue growth of 15.6% over the last two years is below its five-year trend, but we still think the results suggest healthy demand.
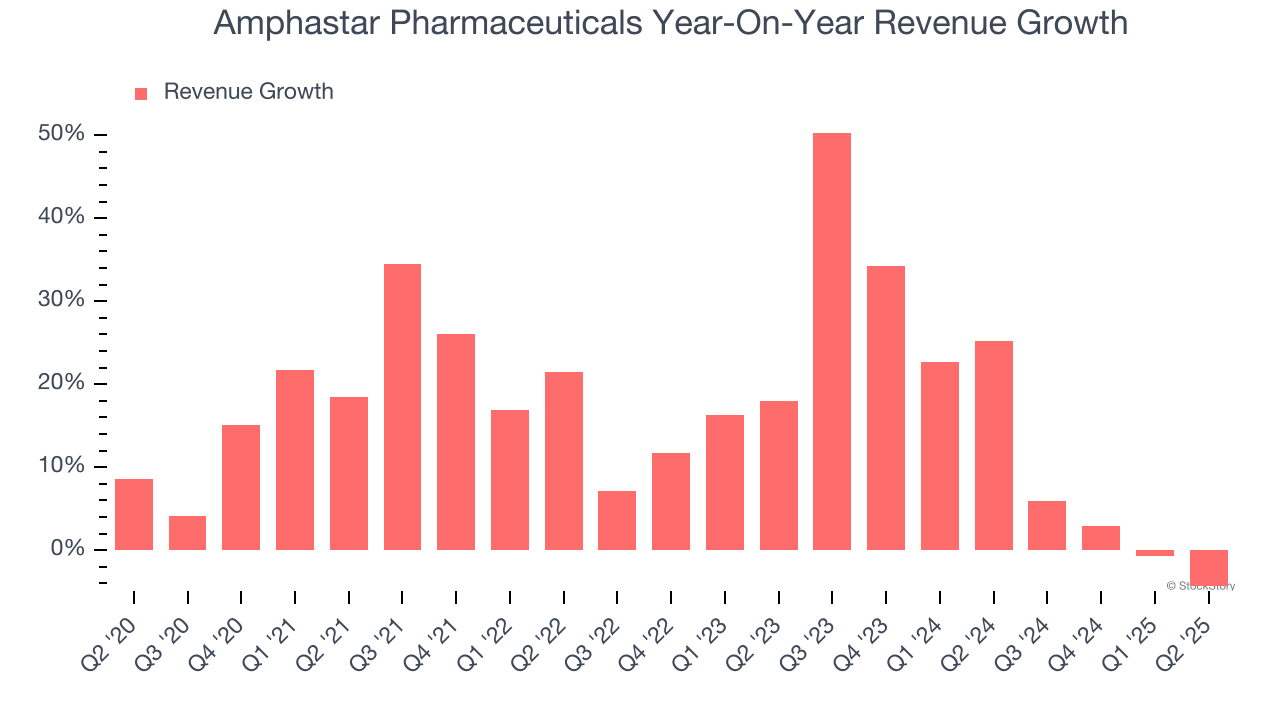
This quarter, Amphastar Pharmaceuticals missed Wall Street’s estimates and reported a rather uninspiring 4.4% year-on-year revenue decline, generating $174.4 million of revenue.
Looking ahead, sell-side analysts expect revenue to grow 1.1% over the next 12 months, a deceleration versus the last two years. This projection doesn't excite us and indicates its products and services will face some demand challenges.
Software is eating the world and there is virtually no industry left that has been untouched by it. That drives increasing demand for tools helping software developers do their jobs, whether it be monitoring critical cloud infrastructure, integrating audio and video functionality, or ensuring smooth content streaming. Click here to access a free report on our 3 favorite stocks to play this generational megatrend.
Adjusted operating margin is one of the best measures of profitability because it tells us how much money a company takes home after subtracting all core expenses, like marketing and R&D. It also removes various one-time costs to paint a better picture of normalized profits.
Amphastar Pharmaceuticals has been an efficient company over the last five years. It was one of the more profitable businesses in the healthcare sector, boasting an average adjusted operating margin of 29.3%.
Analyzing the trend in its profitability, Amphastar Pharmaceuticals’s adjusted operating margin rose by 19 percentage points over the last five years, as its sales growth gave it immense operating leverage. Zooming in on its more recent performance, we can see the company’s trajectory is intact as its margin has also increased by 3.1 percentage points on a two-year basis.
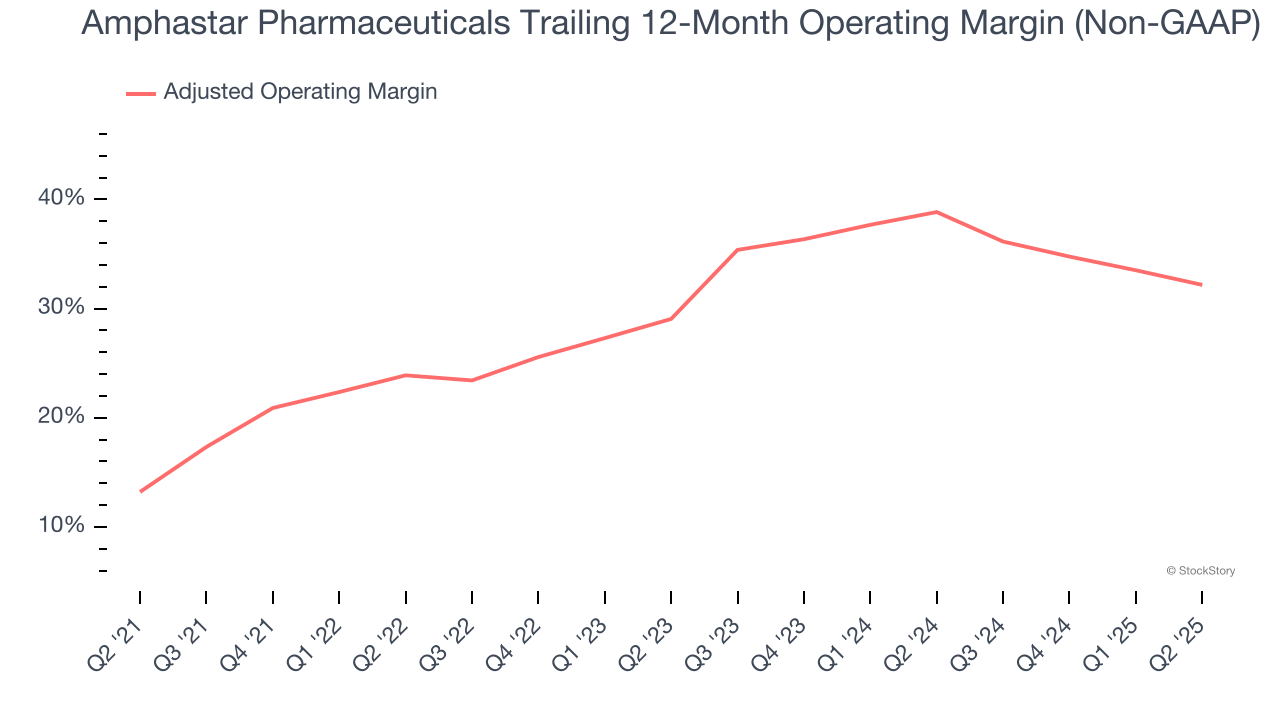
In Q2, Amphastar Pharmaceuticals generated an adjusted operating margin profit margin of 31.4%, down 5.4 percentage points year on year. This contraction shows it was less efficient because its expenses increased relative to its revenue.
Revenue trends explain a company’s historical growth, but the long-term change in earnings per share (EPS) points to the profitability of that growth – for example, a company could inflate its sales through excessive spending on advertising and promotions.
Amphastar Pharmaceuticals’s EPS grew at an astounding 53.3% compounded annual growth rate over the last five years, higher than its 16.7% annualized revenue growth. This tells us the company became more profitable on a per-share basis as it expanded.
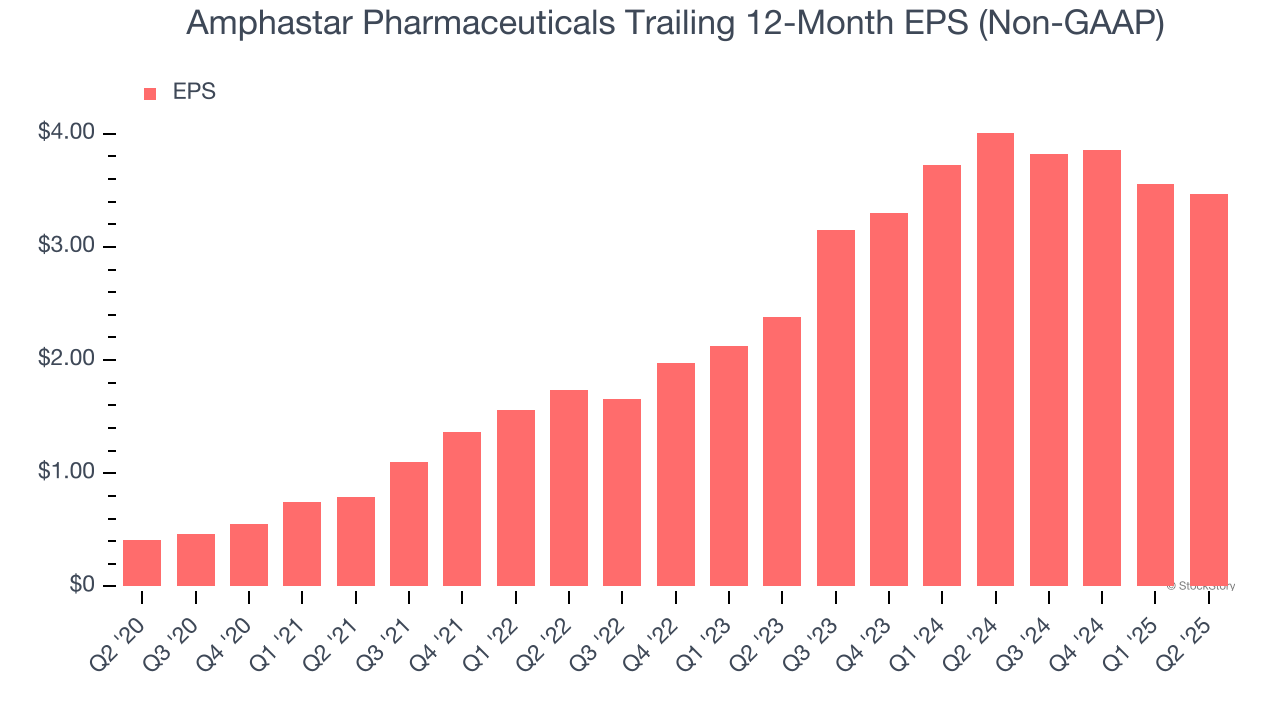
We can take a deeper look into Amphastar Pharmaceuticals’s earnings to better understand the drivers of its performance. As we mentioned earlier, Amphastar Pharmaceuticals’s adjusted operating margin declined this quarter but expanded by 19 percentage points over the last five years. This was the most relevant factor (aside from the revenue impact) behind its higher earnings; interest expenses and taxes can also affect EPS but don’t tell us as much about a company’s fundamentals.
In Q2, Amphastar Pharmaceuticals reported adjusted EPS at $0.85, down from $0.94 in the same quarter last year. Despite falling year on year, this print easily cleared analysts’ estimates. Over the next 12 months, Wall Street expects Amphastar Pharmaceuticals’s full-year EPS of $3.47 to shrink by 5.9%.
We enjoyed seeing Amphastar Pharmaceuticals beat analysts’ EPS expectations this quarter. On the other hand, its revenue slightly missed. Overall, this was a weaker quarter. The stock traded up 6% to $22.95 immediately after reporting.
Should you buy the stock or not? What happened in the latest quarter matters, but not as much as longer-term business quality and valuation, when deciding whether to invest in this stock. We cover that in our actionable full research report which you can read here, it’s free.
| Jun-29 | |
| May-27 | |
| May-08 | |
| May-07 | |
| May-07 | |
| May-06 | |
| Apr-30 | |
| Apr-06 | |
| Mar-04 | |
| Mar-04 | |
| Mar-02 | |
| Feb-27 | |
| Feb-27 | |
| Feb-27 | |
| Feb-26 |
Join thousands of traders who make more informed decisions with our premium features. Real-time quotes, advanced visualizations, alerts, and much more.
Learn more about Finviz Elite