|
|
|

|
|||||
|
|
|
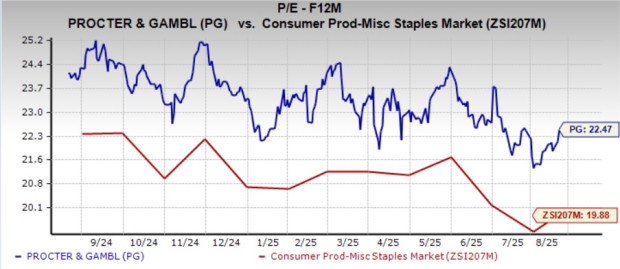
The Procter & Gamble Company PG has been gaining by leveraging its solid market position and focusing on productivity and cost-efficiency. However, its current forward 12-month price-to-earnings (P/E) ratio of 22.47X raises questions about whether the stock is fairly valued. This multiple is significantly higher than the Zacks Consumer Products – Staples industry average of 19.88X, making the stock appear relatively expensive.
The price-to-sales (P/S) ratio of Procter & Gamble, a distinguished name in the consumer staples sector, is 4.25X, above the industry’s multiple of 2.25X. This adds to investor unease, especially considering its Value Score of D, which suggests that it may not be a strong value proposition at current levels.
At 22.47X P/E, Procter & Gamble is trading at a valuation much higher than its competitors. The company’s peers, such as The Clorox Company CLX, Albertsons Companies ACI and Energizer ENR, are delivering solid growth and trade at more reasonable multiples. Clorox, Albertsons Companies and Energizer have forward 12-month P/E ratios of 19.55X, 9.27X and 7.57X — all significantly lower than that of PG. At such levels, Procter & Gamble’s valuation seems out of step with its growth trajectory.
The PG stock’s premium valuation suggests that investors have strong expectations for its growth. However, the stock currently seems somewhat overvalued. Procter & Gamble’s ability to meet or exceed these lofty expectations is crucial in justifying its premium pricing.
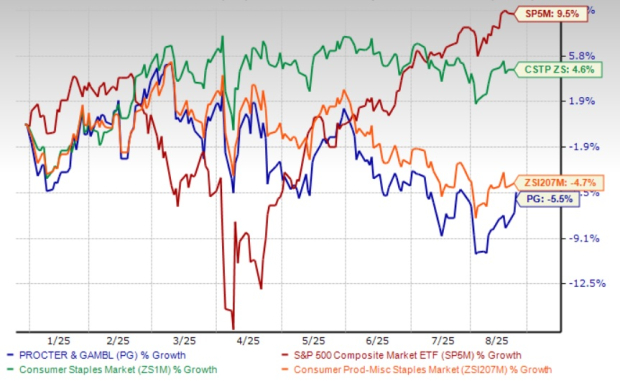
In the year-to-date period, the company’s shares have lost 5.5%, underperforming the broader industry’s decline of 4.7%. The company has lagged the Zacks Consumer Staples sector and the S&P 500’s growth of 4.6% and 9.5%, respectively.
Despite the decline, Procter & Gamble’s performance is better than that of its competitors, Clorox and Energizer, which have lost 25.6% and 18.6%, respectively, year to date. Also, PG has underperformed Albertsons Companies, which fell 1.1% in the same period.
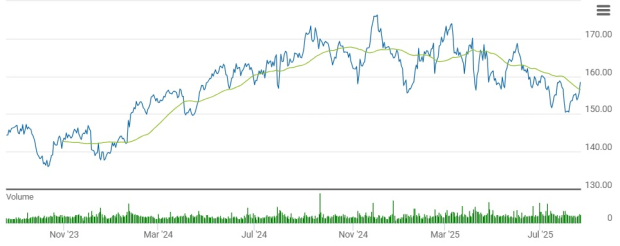
PG’s current share price of $158.40 trades 12.2% below its recent 52-week high mark of $180.43. The stock trades 5.7% above its 52-week low of $149.91.
Procter & Gamble trades above its 50-day moving average, indicating robust upward momentum and price stability. The moving average is an important indicator for gauging market trends and momentum.
Procter & Gamble’s expensive valuation remains a point of debate as its stock has slowed after a strong run-up. On the positive side, the company continues to deliver broad-based strength across several categories. Fabric & Home Care, Baby & Feminine Care, and Grooming posted solid results, while Beauty saw renewed momentum from premium offerings. The company has also been able to drive productivity gains and brand pricing power, which offset much of the cost inflation pressures. Additionally, PG’s global scale and portfolio of trusted brands provide a buffer in a slower consumer spending environment.
The company delivered solid fiscal 2025 results, with organic sales rising 4% and pricing power contributing significantly to revenue growth. Core EPS increased 12%, reflecting both cost discipline and operational efficiency.
Management also emphasized that productivity savings and supply-chain improvements are expected to sustain margins, while investments in innovation and brand strength continue to support market share gains. Additionally, PG’s long track record of dividend growth makes it attractive to defensive, income-focused investors.
However, challenges remain. Management flagged tariff-related headwinds in markets such as Mexico, which may weigh on margins, going forward. The competitive landscape is intensifying, particularly in value-focused categories where price-sensitive consumers are trading down. Currency volatility and rising input costs also remain risks. Importantly, the recent slowdown in stock performance reflects investor concerns that PG’s earnings growth may not be sufficient to support its elevated valuation.
The company faces persistent headwinds from softer consumer demand in discretionary categories and heightened competition, particularly in emerging markets. Volumes remain under pressure, with much of recent growth driven by pricing rather than unit expansion, raising concerns about elasticity and consumer trade-down. Currency fluctuations and elevated commodity costs may further constrain margin expansion despite ongoing productivity efforts. Management’s cautious outlook for fiscal 2026, with organic growth guidance of 2-4%, suggests a slowdown from the recent momentum.
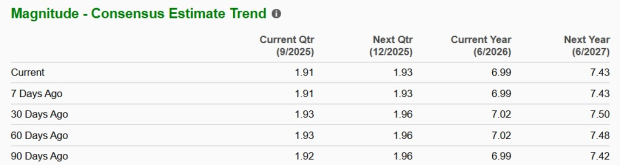
The Zacks Consensus Estimate for Procter & Gamble’s fiscal 2026 and 2027 EPS moved down 0.4% and 0.9%, respectively, in the last 30 days. However, revenue and EPS estimates for fiscal 2026 and 2027 indicate year-over-year growth.
For fiscal 2026, the Zacks Consensus Estimate for PG’s revenues and EPS implies year-over-year growth of 3.2% and 2.3%, respectively. The consensus mark for fiscal 2027 revenues and EPS indicates 3.1% and 6.3% year-over-year growth, respectively.
While PG’s brand equity, cost controls and dividend reliability support its premium multiple, near-term risks, sluggish volume growth, consumer trade-down, and macro headwinds dilute the bull case. The valuation can be justified for long-term defensive investors, but short-term upside may remain limited without stronger volume recovery. The risk-reward balance is less compelling amid tariff headwinds, uneven category trends, and macroeconomic pressures. For long-term investors, PG remains a quality compounder, but near-term upside may be constrained unless earnings growth reaccelerates.
However, absent stronger earnings momentum, the stock’s elevated valuation may cap near-term gains. Investors with positions may find it prudent to retain positions in this Zacks Rank #3 (Hold) stock, while awaiting clearer signs of reacceleration. You can see the complete list of today’s Zacks #1 Rank (Strong Buy) stocks here.
Want the latest recommendations from Zacks Investment Research? Today, you can download 7 Best Stocks for the Next 30 Days. Click to get this free report
This article originally published on Zacks Investment Research (zacks.com).
| 9 hours | |
| Jul-15 | |
| Jul-15 | |
| Jul-14 | |
| Jul-14 | |
| Jul-14 | |
| Jul-14 | |
| Jul-13 | |
| Jul-13 | |
| Jul-10 | |
| Jul-09 | |
| Jul-09 | |
| Jul-09 | |
| Jul-07 | |
| Jul-07 |
Join thousands of traders who make more informed decisions with our premium features. Real-time quotes, advanced visualizations, alerts, and much more.
Learn more about Finviz Elite