|
|
|

|
|||||
|
|
|

Freight transportation company Union Pacific (NYSE:UNP) met Wall Street’s revenue expectations in Q3 CY2025, with sales up 2.5% year on year to $6.24 billion. Its non-GAAP profit of $3.08 per share was 2.8% above analysts’ consensus estimates.
Is now the time to buy Union Pacific? Find out by accessing our full research report, it’s free for active Edge members.
Part of the transcontinental railroad project, Union Pacific (NYSE:UNP) is a freight transportation company that operates a major railroad network.
A company’s long-term sales performance can indicate its overall quality. Any business can experience short-term success, but top-performing ones enjoy sustained growth for years. Unfortunately, Union Pacific’s 4.6% annualized revenue growth over the last five years was tepid. This was below our standard for the industrials sector and is a poor baseline for our analysis.
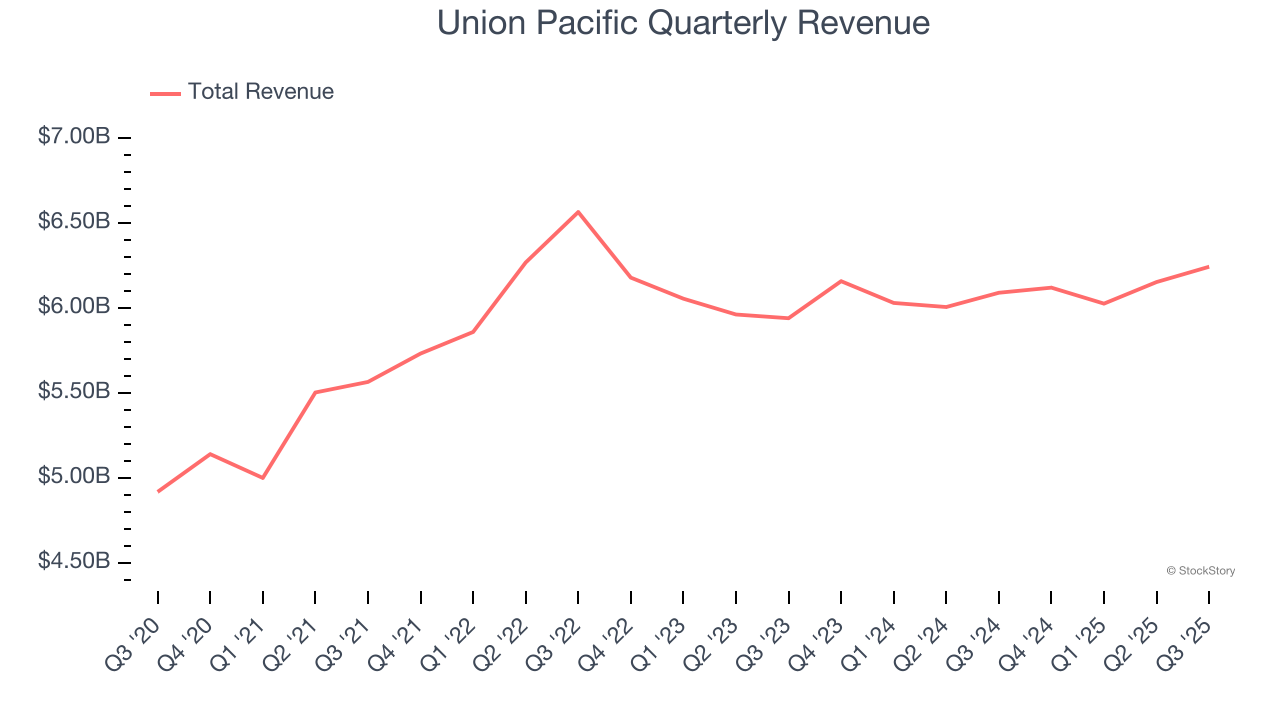
Long-term growth is the most important, but within industrials, a half-decade historical view may miss new industry trends or demand cycles. Union Pacific’s recent performance shows its demand has slowed as its revenue was flat over the last two years. We also note many other Rail Transportation businesses have faced declining sales because of cyclical headwinds. While Union Pacific’s growth wasn’t the best, it did do better than its peers.
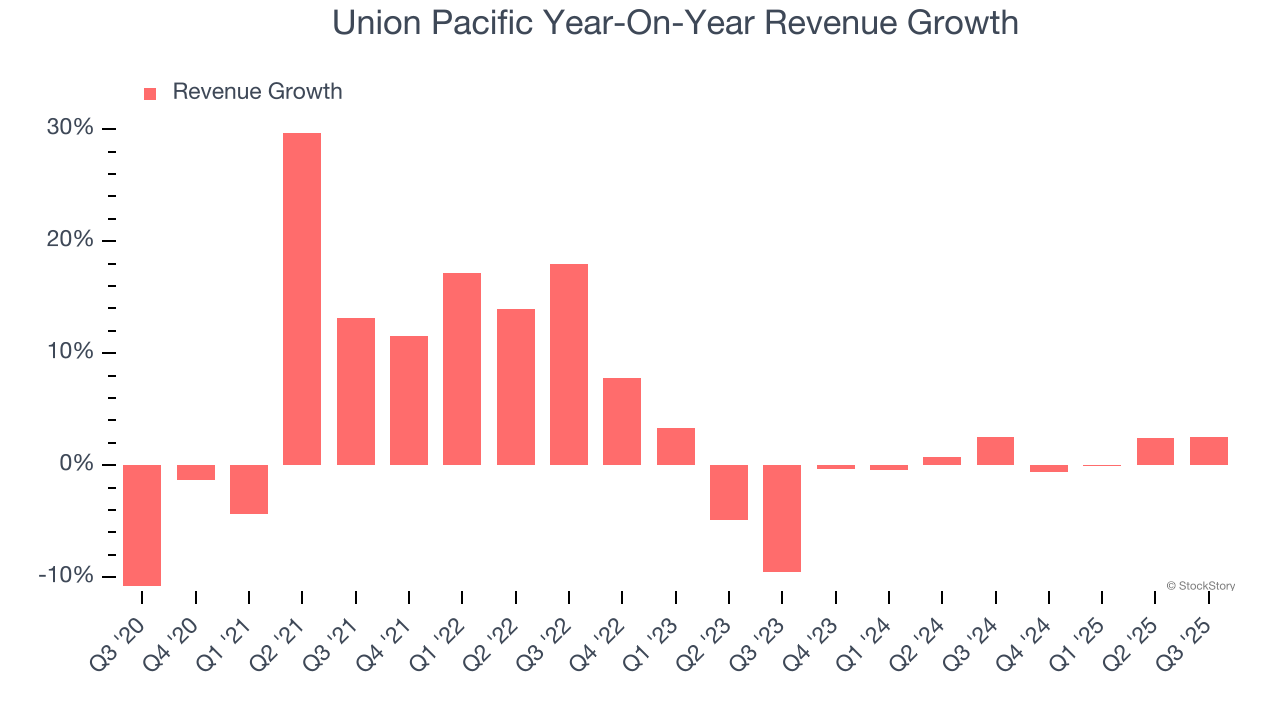
This quarter, Union Pacific grew its revenue by 2.5% year on year, and its $6.24 billion of revenue was in line with Wall Street’s estimates.
Looking ahead, sell-side analysts expect revenue to grow 3.2% over the next 12 months. Although this projection indicates its newer products and services will spur better top-line performance, it is still below the sector average.
Unless you’ve been living under a rock, it should be obvious by now that generative AI is going to have a huge impact on how large corporations do business. While Nvidia and AMD are trading close to all-time highs, we prefer a lesser-known (but still profitable) stock benefiting from the rise of AI. Click here to access our free report one of our favorites growth stories.
Operating margin is a key measure of profitability. Think of it as net income - the bottom line - excluding the impact of taxes and interest on debt, which are less connected to business fundamentals.
Union Pacific has been a well-oiled machine over the last five years. It demonstrated elite profitability for an industrials business, boasting an average operating margin of 40%. This result isn’t surprising as its high gross margin gives it a favorable starting point.
Looking at the trend in its profitability, Union Pacific’s operating margin decreased by 1.4 percentage points over the last five years. Many Rail Transportation companies also saw their margins fall (along with revenue, as mentioned above) because the cycle turned in the wrong direction. We hope Union Pacific can emerge from this a stronger company, as the silver lining of a downturn is that market share can be won and efficiencies found.
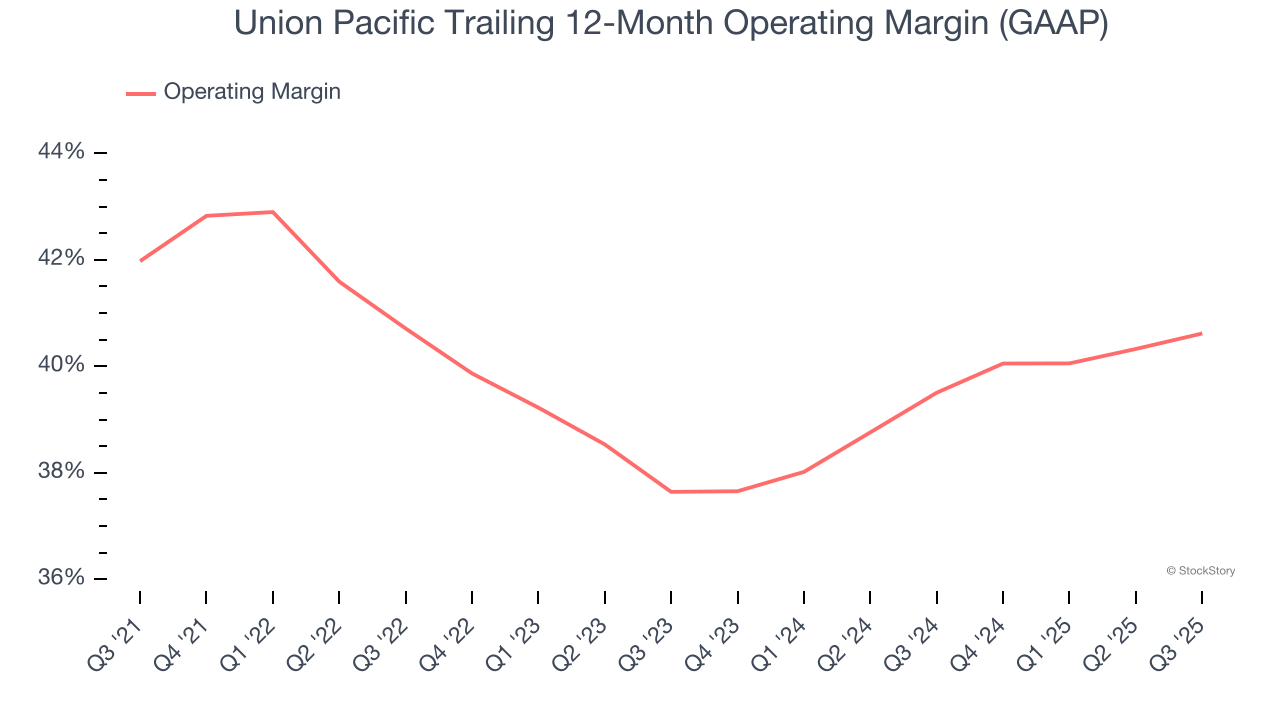
In Q3, Union Pacific generated an operating margin profit margin of 40.8%, up 1.2 percentage points year on year. The increase was encouraging, and because its operating margin rose more than its gross margin, we can infer it was more efficient with expenses such as marketing, R&D, and administrative overhead.
Revenue trends explain a company’s historical growth, but the long-term change in earnings per share (EPS) points to the profitability of that growth – for example, a company could inflate its sales through excessive spending on advertising and promotions.
Union Pacific’s EPS grew at a decent 8.5% compounded annual growth rate over the last five years, higher than its 4.6% annualized revenue growth. However, this alone doesn’t tell us much about its business quality because its operating margin didn’t improve.
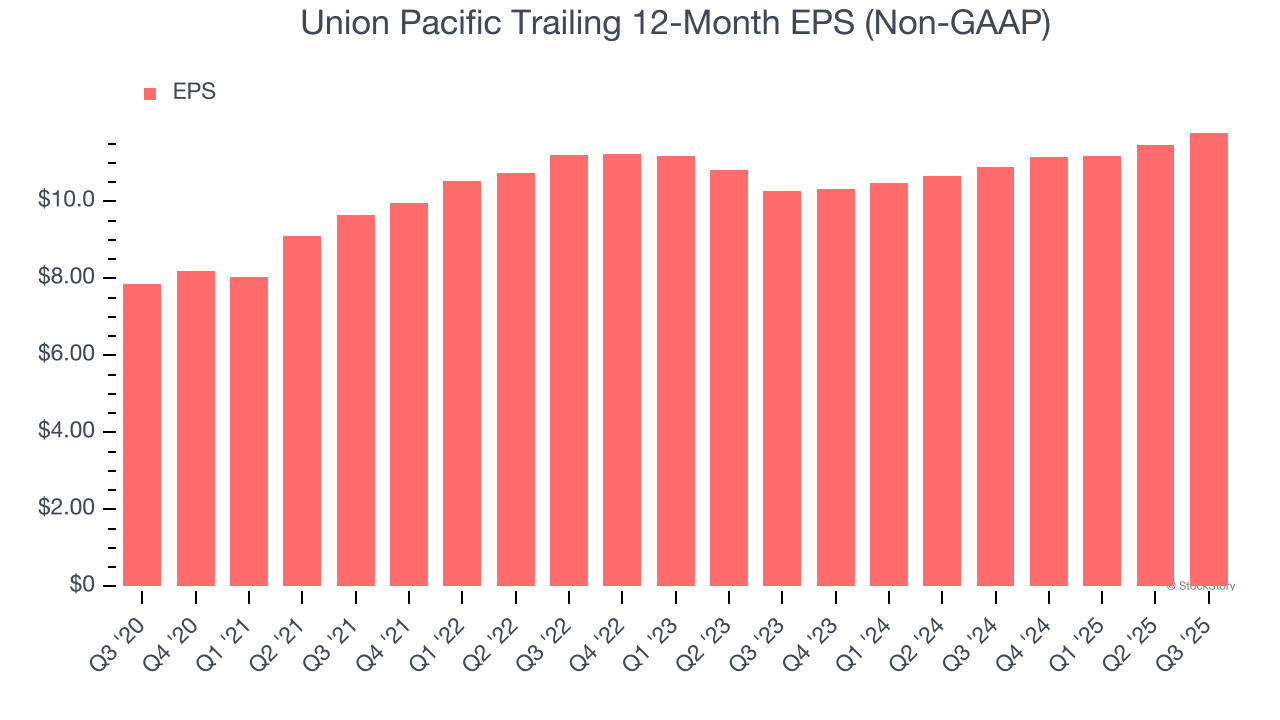
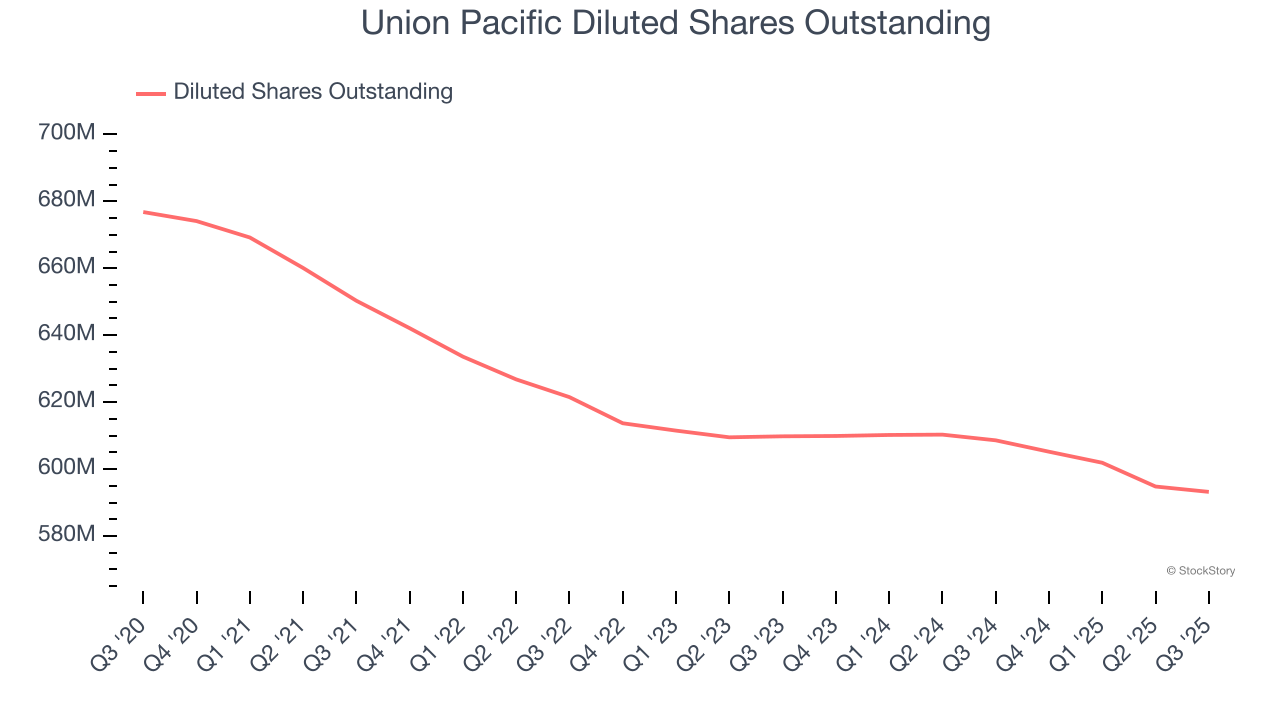
Diving into Union Pacific’s quality of earnings can give us a better understanding of its performance. A five-year view shows that Union Pacific has repurchased its stock, shrinking its share count by 12.4%. This tells us its EPS outperformed its revenue not because of increased operational efficiency but financial engineering, as buybacks boost per share earnings.
Like with revenue, we analyze EPS over a more recent period because it can provide insight into an emerging theme or development for the business.
For Union Pacific, its two-year annual EPS growth of 7.1% was lower than its five-year trend. We hope its growth can accelerate in the future.
In Q3, Union Pacific reported adjusted EPS of $3.08, up from $2.75 in the same quarter last year. This print beat analysts’ estimates by 2.8%. Over the next 12 months, Wall Street expects Union Pacific’s full-year EPS of $11.79 to grow 5.3%.
It was good to see Union Pacific beat analysts’ EPS expectations this quarter on in line revenue. Overall, this was a decent quarter. The stock remained flat at $226.25 immediately following the results.
Should you buy the stock or not? If you’re making that decision, you should consider the bigger picture of valuation, business qualities, as well as the latest earnings. We cover that in our actionable full research report which you can read here, it’s free for active Edge members.
| Apr-01 | |
| Mar-31 | |
| Mar-26 | |
| Mar-24 | |
| Mar-23 | |
| Mar-20 | |
| Mar-19 | |
| Mar-19 | |
| Mar-18 | |
| Mar-15 | |
| Mar-11 | |
| Mar-11 | |
| Mar-10 | |
| Mar-10 | |
| Mar-10 |
Join thousands of traders who make more informed decisions with our premium features. Real-time quotes, advanced visualizations, alerts, and much more.
Learn more about Finviz Elite