Stock Yards Bank (NASDAQ:SYBT) Exceeds Q3 Expectations

Regional banking company Stock Yards Bancorp (NASDAQ:SYBT) reported Q3 CY2025 results topping the market’s revenue expectations, with sales up 13.1% year on year to $101.5 million. Its GAAP profit of $1.23 per share was 6% above analysts’ consensus estimates.
Is now the time to buy Stock Yards Bank? Find out by accessing our full research report, it’s free for active Edge members.
Stock Yards Bank (SYBT) Q3 CY2025 Highlights:
- Net Interest Income: $77.04 million vs analyst estimates of $75.58 million (18.6% year-on-year growth, 1.9% beat)
- Net Interest Margin: 3.6% vs analyst estimates of 3.5% (3.3 basis point beat)
- Revenue: $101.5 million vs analyst estimates of $99.82 million (13.1% year-on-year growth, 1.7% beat)
- Efficiency Ratio: 53% vs analyst estimates of 53% (in line)
- EPS (GAAP): $1.23 vs analyst estimates of $1.16 (6% beat)
- Tangible Book Value per Share: $28.30 vs analyst estimates of $28.03 (15.2% year-on-year growth, 1% beat)
- Market Capitalization: $1.98 billion
“We delivered another record quarter, marked by strong loan production and our sixth consecutive quarter of loan growth across all markets,” commented James A. (Ja) Hillebrand, Chairman and Chief Executive Officer.
Company Overview
Founded in 1904 in Louisville and named after the city's historic livestock market district, Stock Yards Bancorp (NASDAQ:SYBT) operates a regional bank providing commercial banking, wealth management, and trust services across Kentucky, Indiana, and Ohio.
Sales Growth
Two primary revenue streams drive bank earnings. While net interest income, which is earned by charging higher rates on loans than paid on deposits, forms the foundation, fee-based services across banking, credit, wealth management, and trading operations provide additional income. Luckily, Stock Yards Bank’s revenue grew at an incredible 16% compounded annual growth rate over the last five years. Its growth beat the average banking company and shows its offerings resonate with customers, a helpful starting point for our analysis.
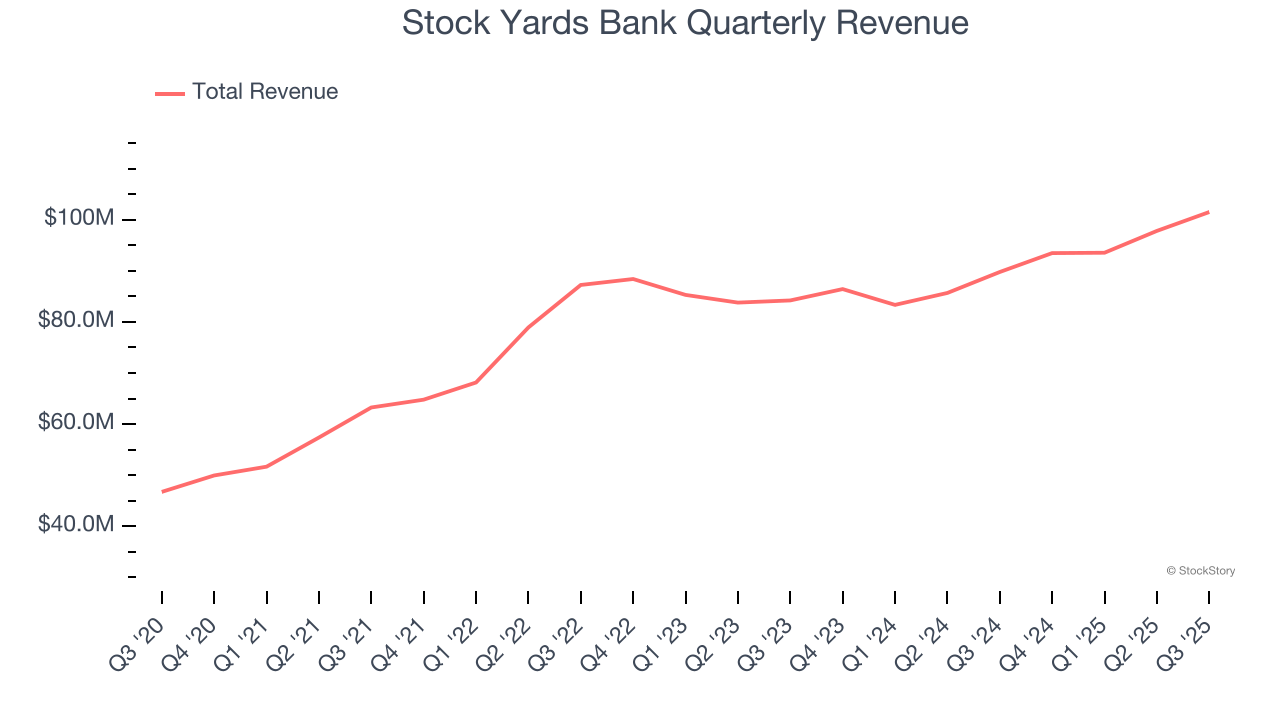
We at StockStory place the most emphasis on long-term growth, but within financials, a half-decade historical view may miss recent interest rate changes, market returns, and industry trends. Stock Yards Bank’s annualized revenue growth of 6.3% over the last two years is below its five-year trend, but we still think the results were respectable.
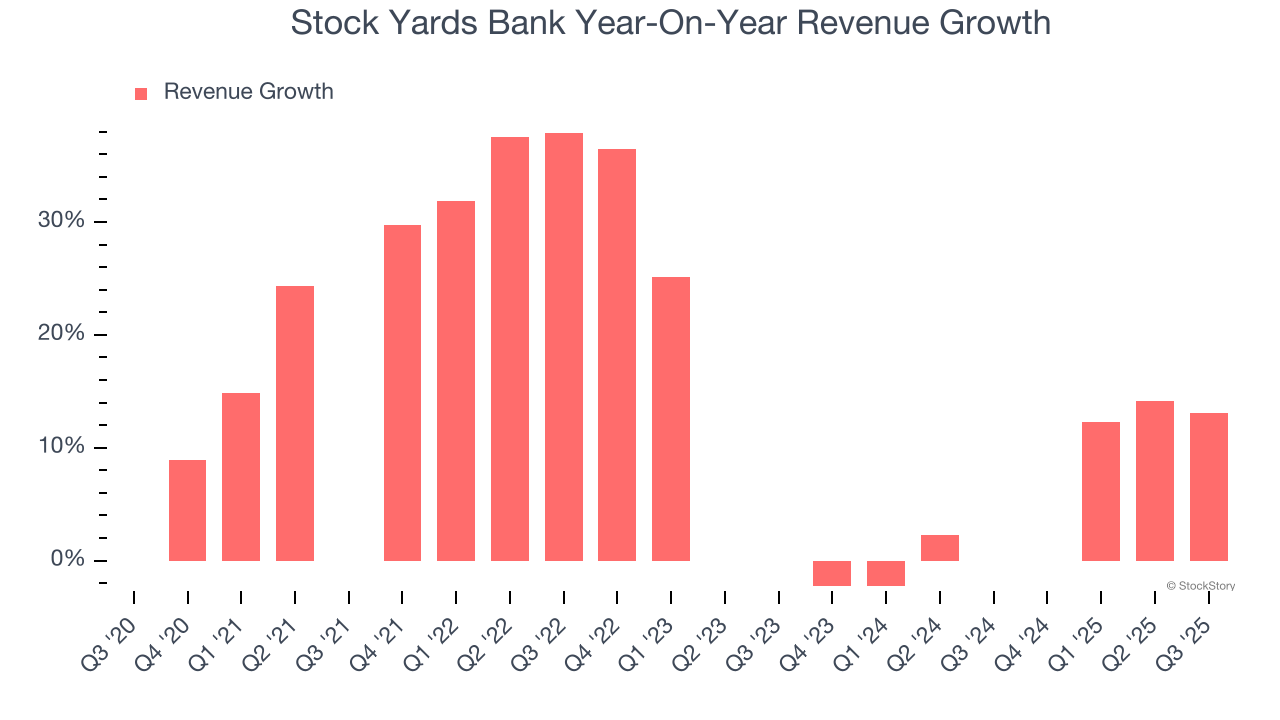
This quarter, Stock Yards Bank reported year-on-year revenue growth of 13.1%, and its $101.5 million of revenue exceeded Wall Street’s estimates by 1.7%.
Net interest income made up 73% of the company’s total revenue during the last five years, meaning lending operations are Stock Yards Bank’s largest source of revenue.
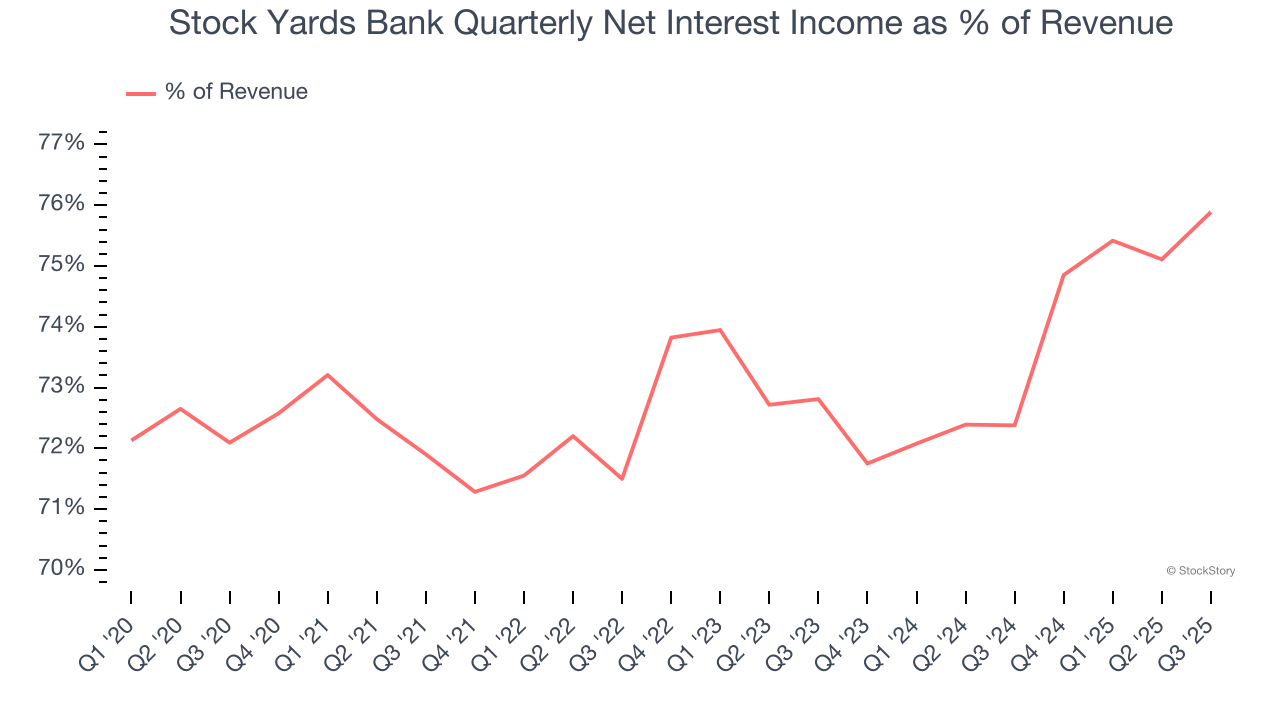
Our experience and research show the market cares primarily about a bank’s net interest income growth as non-interest income is considered a lower-quality and non-recurring revenue source.
Unless you’ve been living under a rock, it should be obvious by now that generative AI is going to have a huge impact on how large corporations do business. While Nvidia and AMD are trading close to all-time highs, we prefer a lesser-known (but still profitable) stock benefiting from the rise of AI. Click here to access our free report one of our favorites growth stories.
Tangible Book Value Per Share (TBVPS)
Banks are balance sheet-driven businesses because they generate earnings primarily through borrowing and lending. They’re also valued based on their balance sheet strength and ability to compound book value (another name for shareholders’ equity) over time.
This is why we consider tangible book value per share (TBVPS) the most important metric to track for banks. TBVPS represents the real, liquid net worth per share of a bank, excluding intangible assets that have debatable value upon liquidation. Traditional metrics like EPS are helpful but face distortion from M&A activity and loan loss accounting rules.
Stock Yards Bank’s TBVPS grew at an exceptional 9.2% annual clip over the last five years. TBVPS growth has also accelerated recently, growing by 18.5% annually over the last two years from $20.17 to $28.30 per share.
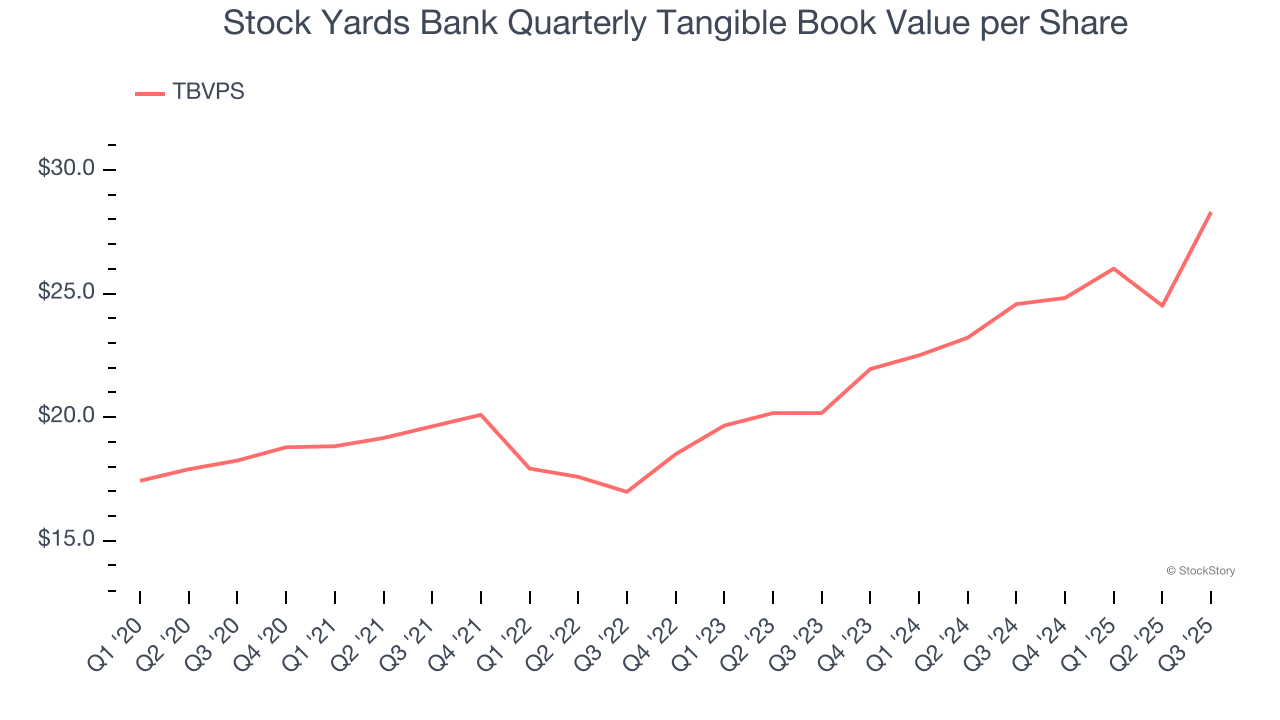
Over the next 12 months, Consensus estimates call for Stock Yards Bank’s TBVPS to grow by 11.8% to $31.65, top-notch growth rate.
Key Takeaways from Stock Yards Bank’s Q3 Results
It was encouraging to see Stock Yards Bank beat analysts’ net interest income and net interest margin expectations this quarter. We were also happy its revenue, EPS, and TBVPS outperformed Wall Street’s estimates. Overall, this print had some key positives. The stock remained flat at $66.42 immediately after reporting.
Indeed, Stock Yards Bank had a rock-solid quarterly earnings result, but is this stock a good investment here? If you’re making that decision, you should consider the bigger picture of valuation, business qualities, as well as the latest earnings. We cover that in our actionable full research report which you can read here, it’s free for active Edge members.
Mentioned In This Article
Latest News
| Sep-21 | |
| Aug-24 | |
| Aug-19 | |
| Jul-29 | |
| Jul-29 | |
| May-20 | |
| May-01 | |
| Apr-22 | |
| Apr-22 | |
| Feb-25 | |
| Feb-04 | |
| Feb-02 | |
| Jan-31 | |
| Jan-27 | |
| Jan-27 |
