|
|
|

|
|||||
|
|
|
Warren Buffett's Berkshire Hathaway was a net seller of stocks in the third quarter, despite reporting a record $382 billion in cash and U.S. Treasury bills.
While Buffett has historically been a net buyer of stocks, his disposition changed three years ago, likely due to his belief that valuations are quite elevated.
The S&P 500 recorded a CAPE ratio of 39.5 in October, a valuation that has historically preceded losses over the next one, two, and three years.
Berkshire Hathaway (NYSE: BRK.A) (NYSE: BRK.B) released its third-quarter financial report last weekend and it contained an ominous warning from CEO Warren Buffett, the person responsible for managing the vast majority of the company's investment portfolio.
Berkshire was once again a net seller of stock in third quarter, meaning Buffett sold more stock than he purchased, even though the company reported a record $382 billion in cash and U.S. Treasury bills. That means Buffett had plenty of available capital and simply chose to keep it out of the stock market.
Where to invest $1,000 right now? Our analyst team just revealed what they believe are the 10 best stocks to buy right now, when you join Stock Advisor. See the stocks »
Here's what investors should know.
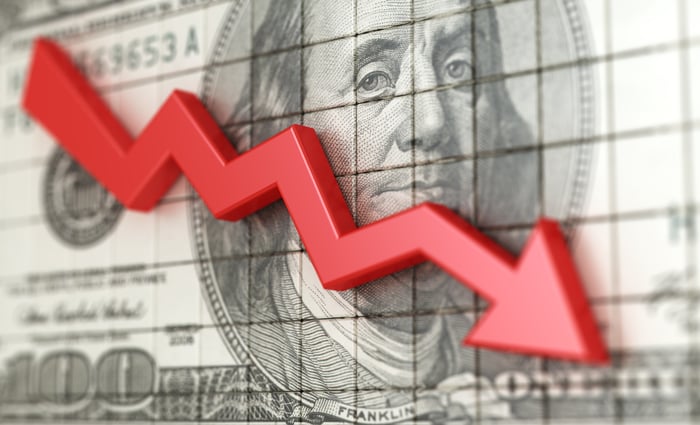
Image source: Getty Images.
In 2018, Warren Buffett told CNBC, "It's hard to think of very many months when we haven't been a net buyer of stocks." But that has changed. Buffett and fellow investment managers Todd Combs and Ted Weschler have been net sellers of stocks in 12 straight quarters, with net sales totaling $184 billion during that period.
Meanwhile, Berkshire has amassed $382 billion in cash and short-term investments, which is more than all but two dozen S&P 500 (SNPINDEX: ^GSPC) companies are currently worth. So, despite having an enormous amount of investable capital on the balance sheet, Buffett took more money from the stock market than he added during the third quarter.
I think there are two reasons he has been more inclined to sell stocks in recent years. First, Berkshire is much larger today than it was in 2018, and the number of potential investments that could move the financial needle for the company is much smaller. Put differently, Berkshire is effectively fishing in a smaller pond. Second, Buffett is likely concerned about the stock market's valuation.
Whatever the reason, the S&P 500 has generally performed worse following quarters in which Buffett was a net seller. In the last six years, the index's average one-year return has been 5 percentage points lower under those circumstances. And history says there may be challenging times ahead for investors.
In October, the S&P 500 recorded a cyclically adjusted price-to-earnings (CAPE) ratio of 39.5, the highest level in a quarter century. In fact, the index has only achieved a monthly CAPE ratio above 39 during one other period in history: the dot-com bubble.
The S&P 500's CAPE ratio drifted above 39 in January 1999 as the dot-com bubble formed and remained above that level for 22 months until the bubble began to burst in earnest in late 2000. For context, the S&P 500 was created in 1957, which was 826 months ago. That its CAPE ratio has only exceeded 39 in 22 months means its current valuation is in the 97th percentile.
Put differently, the S&P 500 has only been this expensive about 3% of the time during its seven-decade history. Unfortunately, the index crashed when this last happened. Detailed below is the S&P 500's average return over the subsequent one, two, and three years after achieving a monthly CAPE ratio above 39.
|
Holding Period |
S&P 500 Average Return After Recording a Monthly CAPE Ratio of 39+ |
|---|---|
|
1 year |
(4%) |
|
2 years |
(20%) |
|
3 years |
(30%) |
Data source: Robert Shiller.
As shown above, the S&P 500 has usually declined sharply after recording a monthly CAPE ratio above 39. In fact, the index will fall 30% over the next three years if its performance matches the historical average.
Past performance is never a guarantee of future results, but investors should not automatically assume this time will be different. Instead, the current market environment warrants caution. That means you should avoid stocks trading at unsustainable valuations, and you should consider building a cash position that will let you capitalize on the next downturn.
Before you buy stock in S&P 500 Index, consider this:
The Motley Fool Stock Advisor analyst team just identified what they believe are the 10 best stocks for investors to buy now… and S&P 500 Index wasn’t one of them. The 10 stocks that made the cut could produce monster returns in the coming years.
Consider when Netflix made this list on December 17, 2004... if you invested $1,000 at the time of our recommendation, you’d have $603,392!* Or when Nvidia made this list on April 15, 2005... if you invested $1,000 at the time of our recommendation, you’d have $1,241,236!*
Now, it’s worth noting Stock Advisor’s total average return is 1,072% — a market-crushing outperformance compared to 194% for the S&P 500. Don’t miss out on the latest top 10 list, available when you join Stock Advisor.
*Stock Advisor returns as of November 3, 2025
Trevor Jennewine has no position in any of the stocks mentioned. The Motley Fool has positions in and recommends Berkshire Hathaway. The Motley Fool has a disclosure policy.
| Feb-28 | |
| Feb-28 |
Stock Market Week: Reaction To Iran, Berkshire Earnings, Apple Event
BRK-B
Investor's Business Daily
|
| Feb-28 |
Stock Market Week: Reaction To Iran, Berkshire Earnings, Apple Event
BRK-A
Investor's Business Daily
|
| Feb-28 | |
| Feb-28 | |
| Feb-28 | |
| Feb-28 | |
| Feb-28 | |
| Feb-28 |
Warren Buffett's successor Greg Abel publishes his first letter to Berkshire Hathaway shareholders
BRK-A
Associated Press Finance
|
| Feb-28 | |
| Feb-28 | |
| Feb-27 | |
| Feb-27 | |
| Feb-27 | |
| Feb-26 |
Join thousands of traders who make more informed decisions with our premium features. Real-time quotes, advanced visualizations, backtesting, and much more.
Learn more about FINVIZ*Elite