|
|
|

|
|||||
|
|
|

Shoe and apparel company Steven Madden (NASDAQ:SHOO) missed Wall Street’s revenue expectations in Q3 CY2025, but sales rose 6.9% year on year to $667.9 million. On the other hand, next quarter’s outlook exceeded expectations with revenue guided to $748.3 million at the midpoint, or 8.7% above analysts’ estimates. Its non-GAAP profit of $0.43 per share was 3.4% below analysts’ consensus estimates.
Is now the time to buy Steven Madden? Find out by accessing our full research report, it’s free for active Edge members.
Edward Rosenfeld, Chairman and Chief Executive Officer, commented, “As anticipated, the third quarter was challenging, driven largely by the impact of new tariffs on goods imported into the United States. That said, we are pleased with underlying demand for our brands and products. Consumers have responded favorably to our Fall assortments, particularly in our flagship Steve Madden brand. The improved trend in Steve Madden, together with our tariff mitigation strategies and the contribution from our recent acquisition Kurt Geiger, position us to deliver stronger financial results beginning in the fourth quarter.”
As seen in the infamous Wolf of Wall Street movie, Steven Madden (NASDAQ:SHOO) is a fashion brand famous for its trendy and innovative footwear, appealing to a young and style-conscious audience.
Reviewing a company’s long-term sales performance reveals insights into its quality. Any business can experience short-term success, but top-performing ones enjoy sustained growth for years. Over the last five years, Steven Madden grew its sales at a 13.2% compounded annual growth rate. Although this growth is acceptable on an absolute basis, it fell short of our standards for the consumer discretionary sector, which enjoys a number of secular tailwinds.
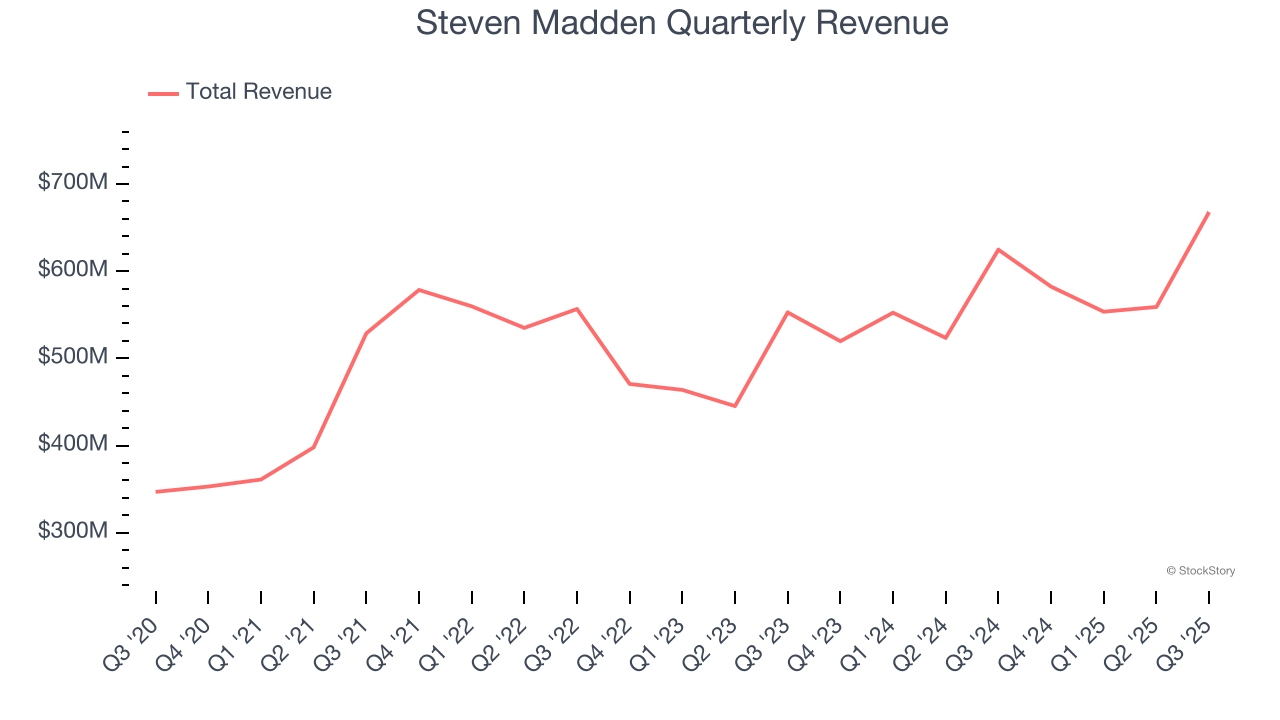
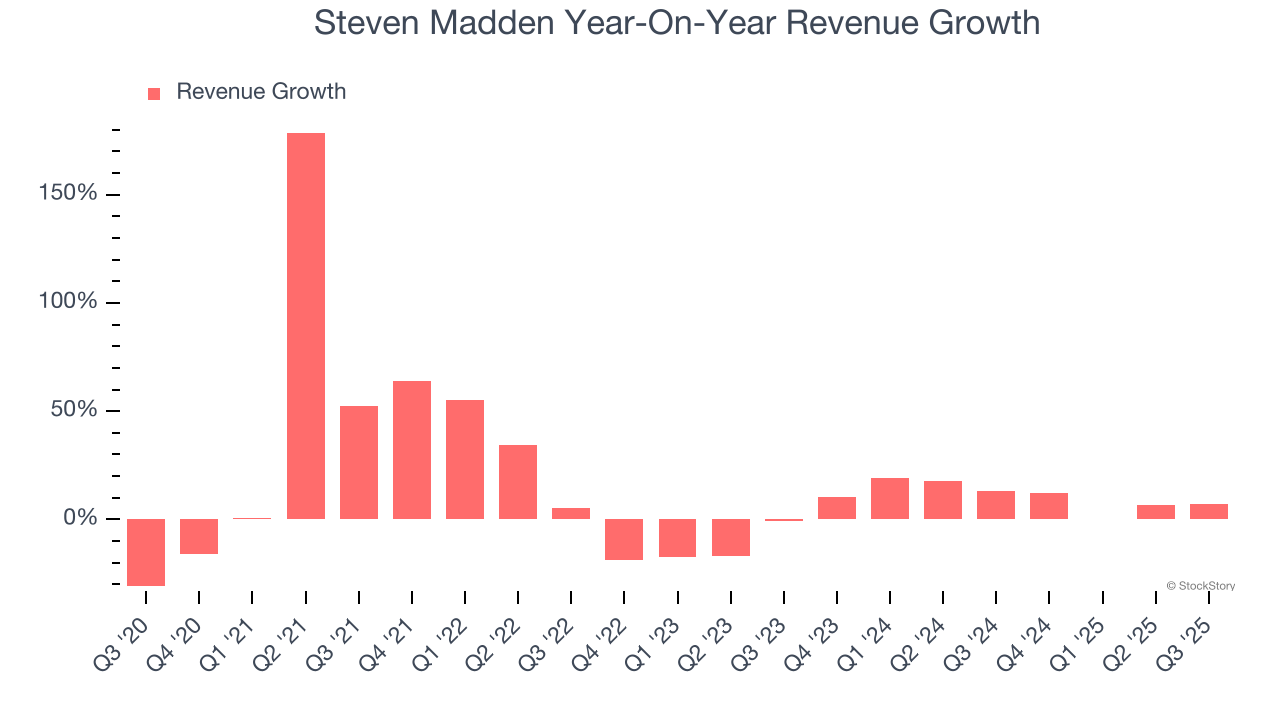
Long-term growth is the most important, but within consumer discretionary, product cycles are short and revenue can be hit-driven due to rapidly changing trends and consumer preferences. Steven Madden’s recent performance shows its demand has slowed as its annualized revenue growth of 10.6% over the last two years was below its five-year trend.
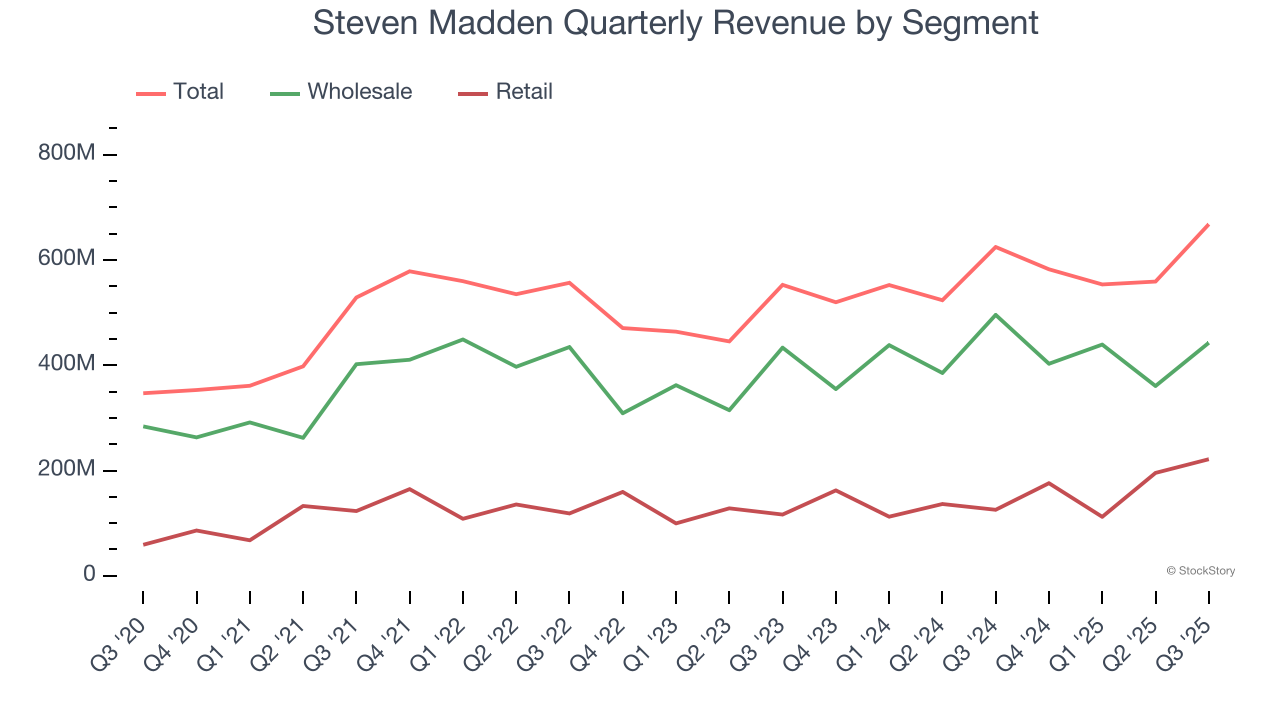
We can better understand the company’s revenue dynamics by analyzing its most important segments, Wholesale and Retail, which are 66.3% and 33.2% of revenue. Over the last two years, Steven Madden’s Wholesale revenue (sales to retailers) averaged 8.7% year-on-year growth while its Retail revenue (direct sales to consumers) averaged 19.6% growth.
This quarter, Steven Madden’s revenue grew by 6.9% year on year to $667.9 million, missing Wall Street’s estimates. Company management is currently guiding for a 28.5% year-on-year increase in sales next quarter.
Looking further ahead, sell-side analysts expect revenue to grow 13.8% over the next 12 months, an improvement versus the last two years. This projection is above the sector average and indicates its newer products and services will spur better top-line performance.
Microsoft, Alphabet, Coca-Cola, Monster Beverage—all began as under-the-radar growth stories riding a massive trend. We’ve identified the next one: a profitable AI semiconductor play Wall Street is still overlooking. Go here for access to our full report.
Operating margin is an important measure of profitability as it shows the portion of revenue left after accounting for all core expenses – everything from the cost of goods sold to advertising and wages. It’s also useful for comparing profitability across companies with different levels of debt and tax rates because it excludes interest and taxes.
Steven Madden’s operating margin has shrunk over the last 12 months and averaged 6.8% over the last two years. The company’s profitability was mediocre for a consumer discretionary business and shows it couldn’t pass its higher operating expenses onto its customers.
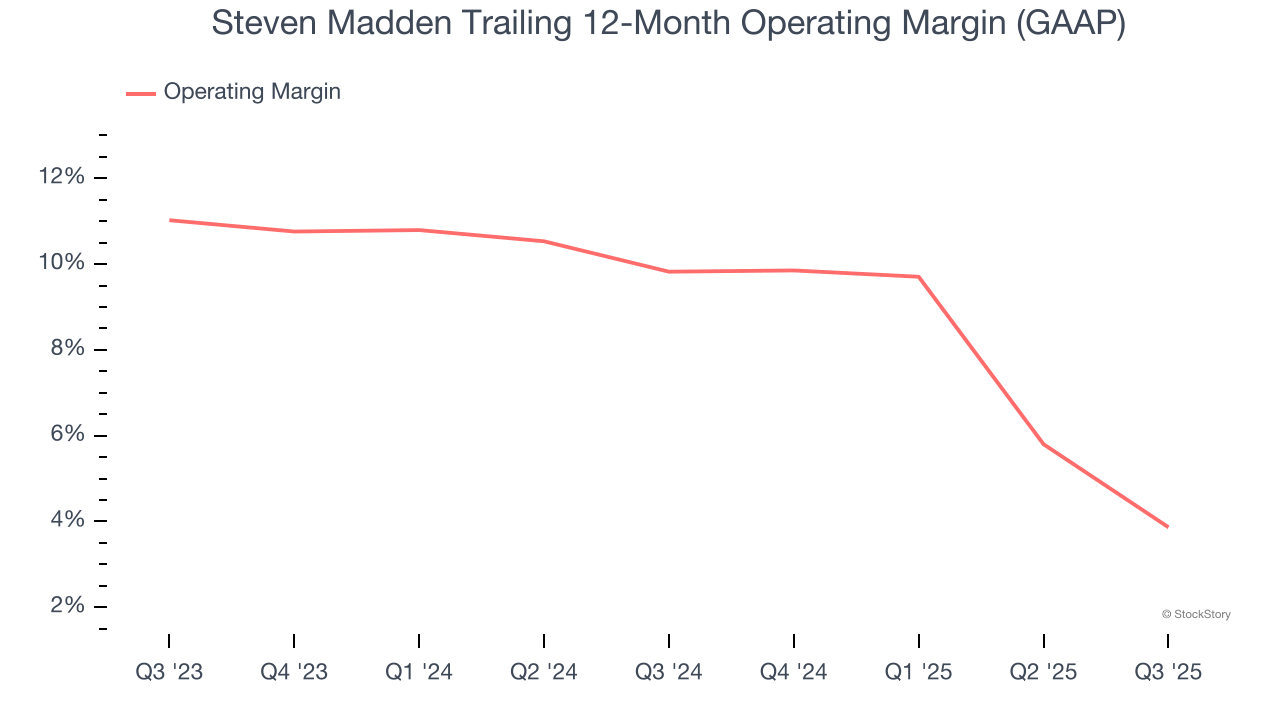
In Q3, Steven Madden generated an operating margin profit margin of 4.7%, down 7.2 percentage points year on year. This contraction shows it was less efficient because its expenses grew faster than its revenue.
Revenue trends explain a company’s historical growth, but the long-term change in earnings per share (EPS) points to the profitability of that growth – for example, a company could inflate its sales through excessive spending on advertising and promotions.
Steven Madden’s EPS grew at a remarkable 18.9% compounded annual growth rate over the last five years, higher than its 13.2% annualized revenue growth. This tells us the company became more profitable on a per-share basis as it expanded.
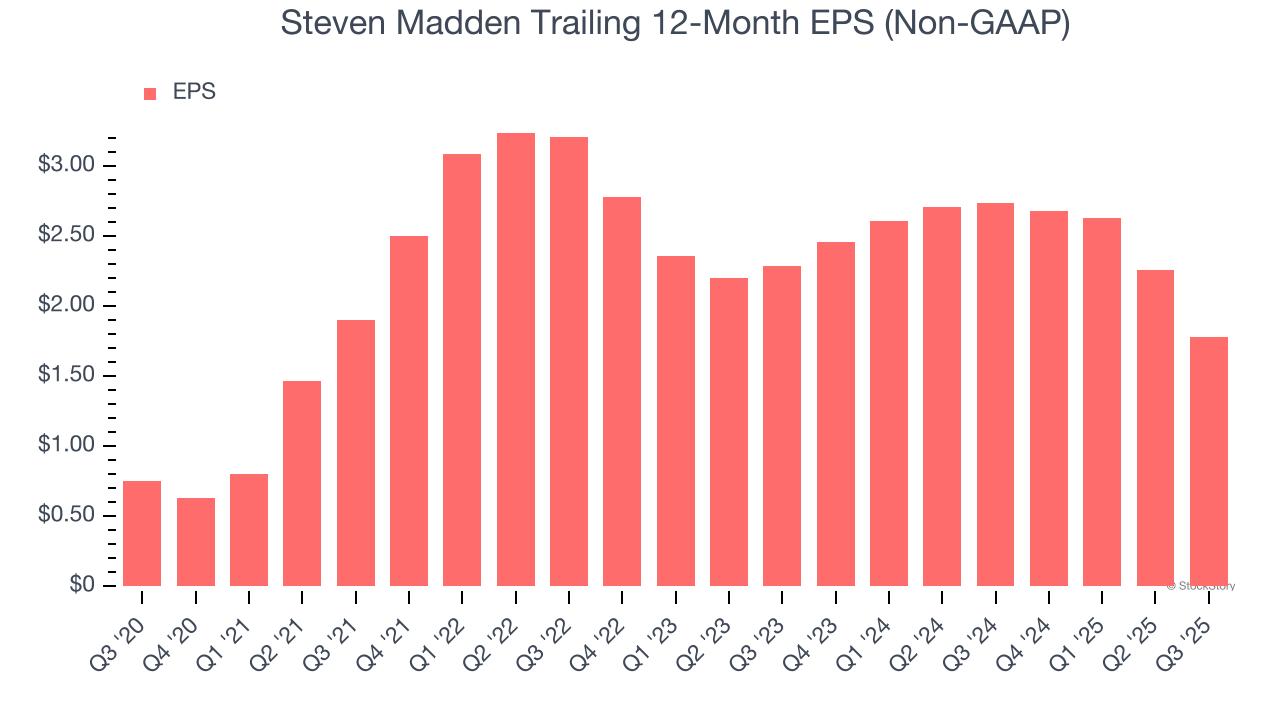
In Q3, Steven Madden reported adjusted EPS of $0.43, down from $0.91 in the same quarter last year. This print missed analysts’ estimates, but we care more about long-term adjusted EPS growth than short-term movements. Over the next 12 months, Wall Street expects Steven Madden’s full-year EPS of $1.78 to grow 2.3%.
We were impressed by Steven Madden’s optimistic EPS guidance for next quarter, which blew past analysts’ expectations. We were also glad its revenue guidance for next quarter trumped Wall Street’s estimates. On the other hand, its Wholesale revenue missed and its revenue fell short of Wall Street’s estimates. Zooming out, we think this was a mixed quarter. The stock remained flat at $33 immediately following the results.
So do we think Steven Madden is an attractive buy at the current price? We think that the latest quarter is only one piece of the longer-term business quality puzzle. Quality, when combined with valuation, can help determine if the stock is a buy. We cover that in our actionable full research report which you can read here, it’s free for active Edge members.
| Jul-16 | |
| Jun-30 | |
| Jun-16 | |
| May-06 | |
| May-06 | |
| May-06 | |
| May-06 | |
| May-06 | |
| Apr-22 | |
| Mar-02 | |
| Feb-25 | |
| Feb-25 | |
| Feb-25 | |
| Feb-25 | |
| Feb-25 |
Join thousands of traders who make more informed decisions with our premium features. Real-time quotes, advanced visualizations, alerts, and much more.
Learn more about Finviz Elite