|
|
|

|
|||||
|
|
|

Homebuilder D.R. Horton (NYSE:DHI) beat Wall Street’s revenue expectations in Q4 CY2025, but sales fell by 9.5% year on year to $6.89 billion. The company expects the full year’s revenue to be around $34.25 billion, close to analysts’ estimates. Its GAAP profit of $2.03 per share was 5.9% above analysts’ consensus estimates.
Is now the time to buy D.R. Horton? Find out by accessing our full research report, it’s free.
One of the largest homebuilding companies in the U.S., D.R. Horton (NYSE:DHI) builds a variety of new construction homes across multiple markets.
A company’s long-term performance is an indicator of its overall quality. Any business can put up a good quarter or two, but many enduring ones grow for years. Thankfully, D.R. Horton’s 8.6% annualized revenue growth over the last five years was decent. Its growth was slightly above the average industrials company and shows its offerings resonate with customers.
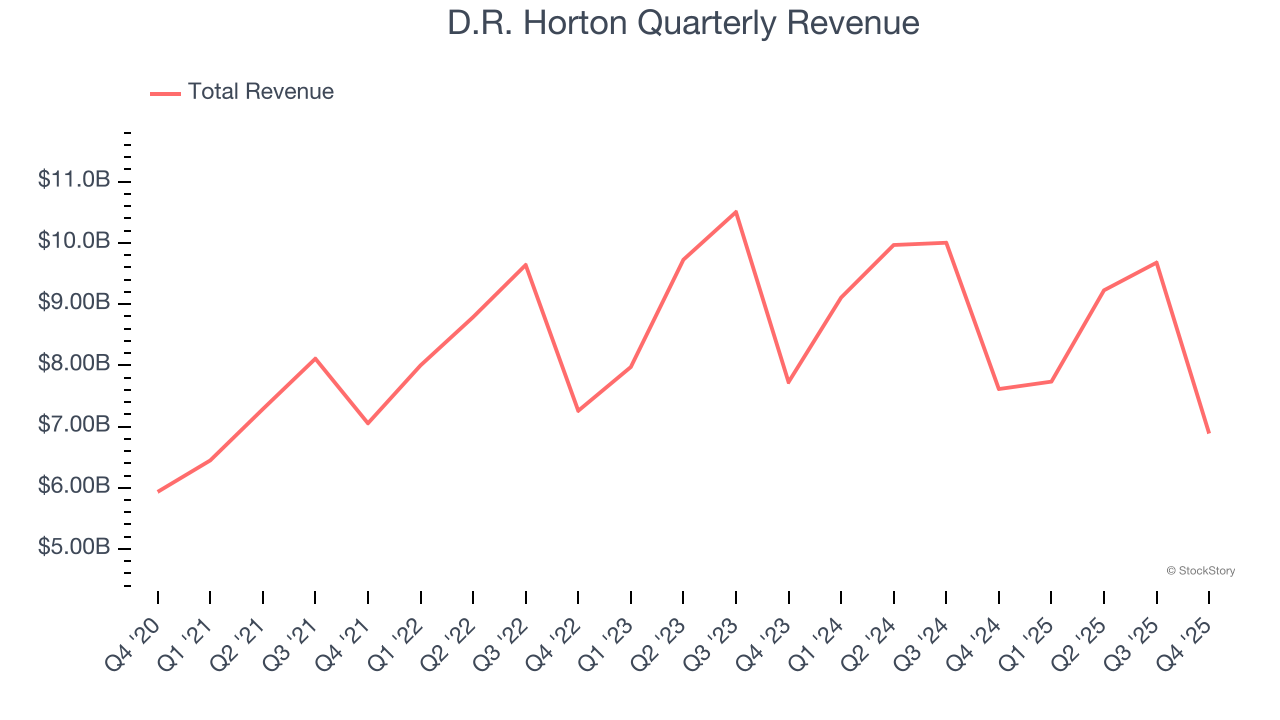
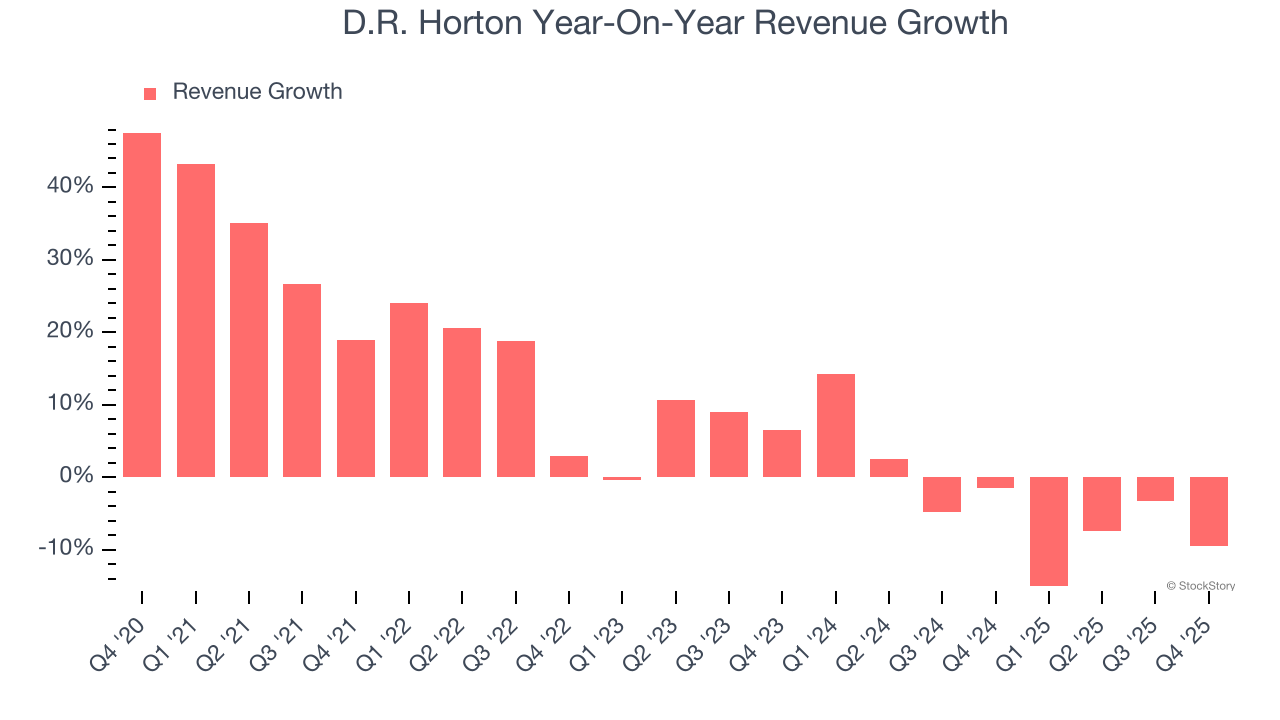
Long-term growth is the most important, but within industrials, a half-decade historical view may miss new industry trends or demand cycles. D.R. Horton’s recent performance marks a sharp pivot from its five-year trend as its revenue has shown annualized declines of 3.4% over the last two years.
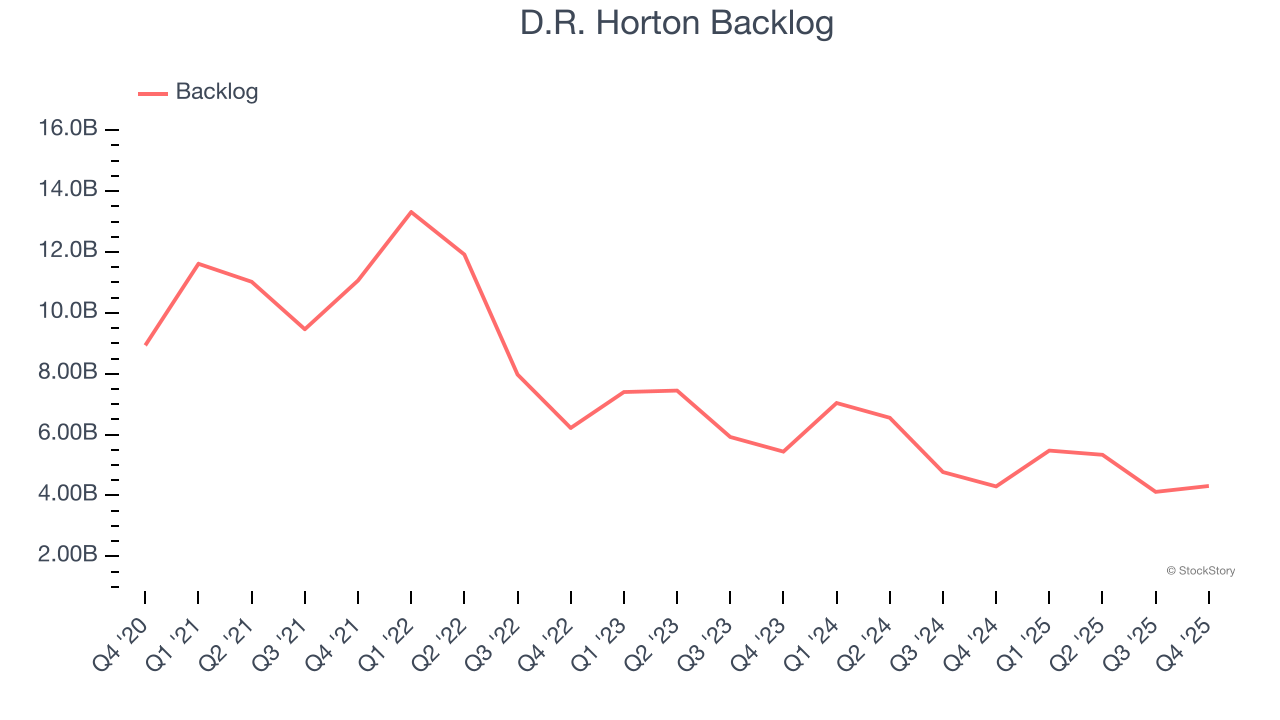
D.R. Horton also reports its backlog, or the value of its outstanding orders that have not yet been executed or delivered. D.R. Horton’s backlog reached $4.31 billion in the latest quarter and averaged 13.9% year-on-year declines over the last two years. Because this number is lower than its revenue growth, we can see the company hasn’t secured enough new orders to maintain its growth rate in the future.
This quarter, D.R. Horton’s revenue fell by 9.5% year on year to $6.89 billion but beat Wall Street’s estimates by 3.4%.
Looking ahead, sell-side analysts expect revenue to grow 3.1% over the next 12 months. Although this projection indicates its newer products and services will fuel better top-line performance, it is still below average for the sector.
The 1999 book Gorilla Game predicted Microsoft and Apple would dominate tech before it happened. Its thesis? Identify the platform winners early. Today, enterprise software companies embedding generative AI are becoming the new gorillas. a profitable, fast-growing enterprise software stock that is already riding the automation wave and looking to catch the generative AI next.
Operating margin is one of the best measures of profitability because it tells us how much money a company takes home after procuring and manufacturing its products, marketing and selling those products, and most importantly, keeping them relevant through research and development.
D.R. Horton has been a well-oiled machine over the last five years. It demonstrated elite profitability for an industrials business, boasting an average operating margin of 17.2%. This result was particularly impressive because of its low gross margin, which is mostly a factor of what it sells and takes huge shifts to move meaningfully. Companies have more control over their operating margins, and it’s a show of well-managed operations if they’re high when gross margins are low.
Analyzing the trend in its profitability, D.R. Horton’s operating margin decreased by 7.7 percentage points over the last five years. This raises questions about the company’s expense base because its revenue growth should have given it leverage on its fixed costs, resulting in better economies of scale and profitability.
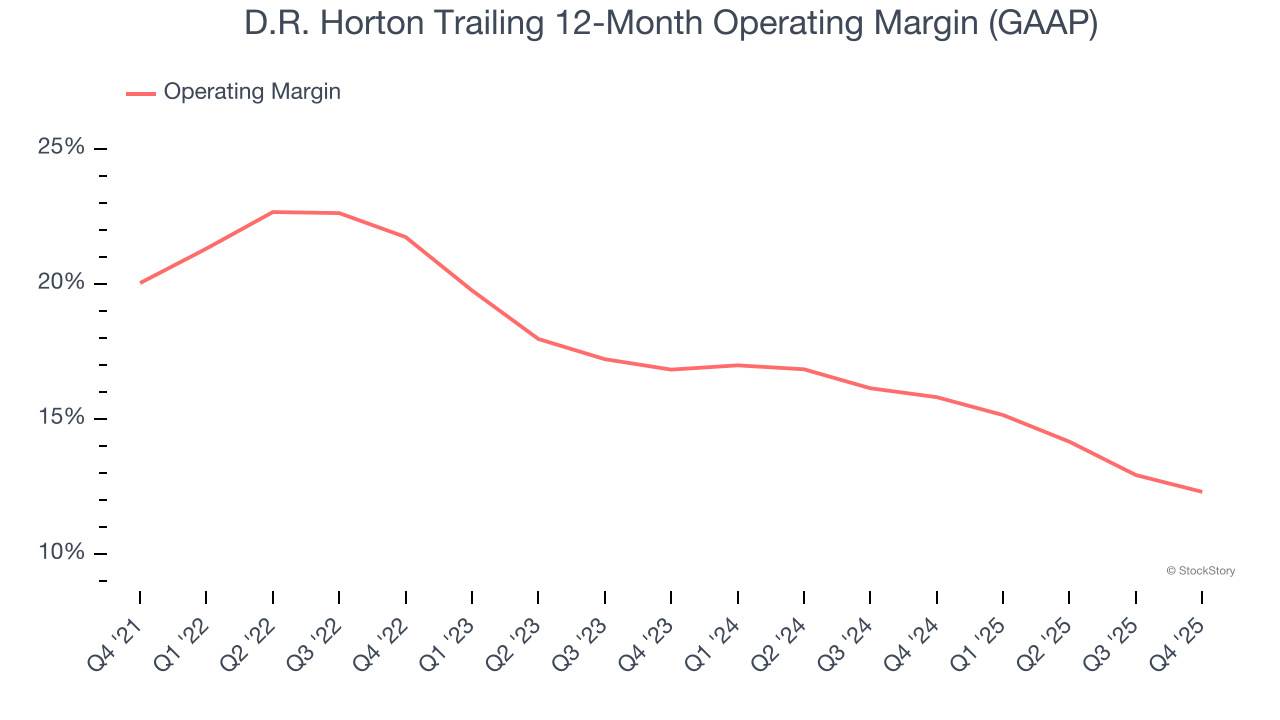
This quarter, D.R. Horton generated an operating margin profit margin of 10.6%, down 3 percentage points year on year. Since D.R. Horton’s operating margin decreased more than its gross margin, we can assume it was less efficient because expenses such as marketing, R&D, and administrative overhead increased.
Revenue trends explain a company’s historical growth, but the long-term change in earnings per share (EPS) points to the profitability of that growth – for example, a company could inflate its sales through excessive spending on advertising and promotions.
D.R. Horton’s decent 8.3% annual EPS growth over the last five years aligns with its revenue performance. This tells us it maintained its per-share profitability as it expanded.
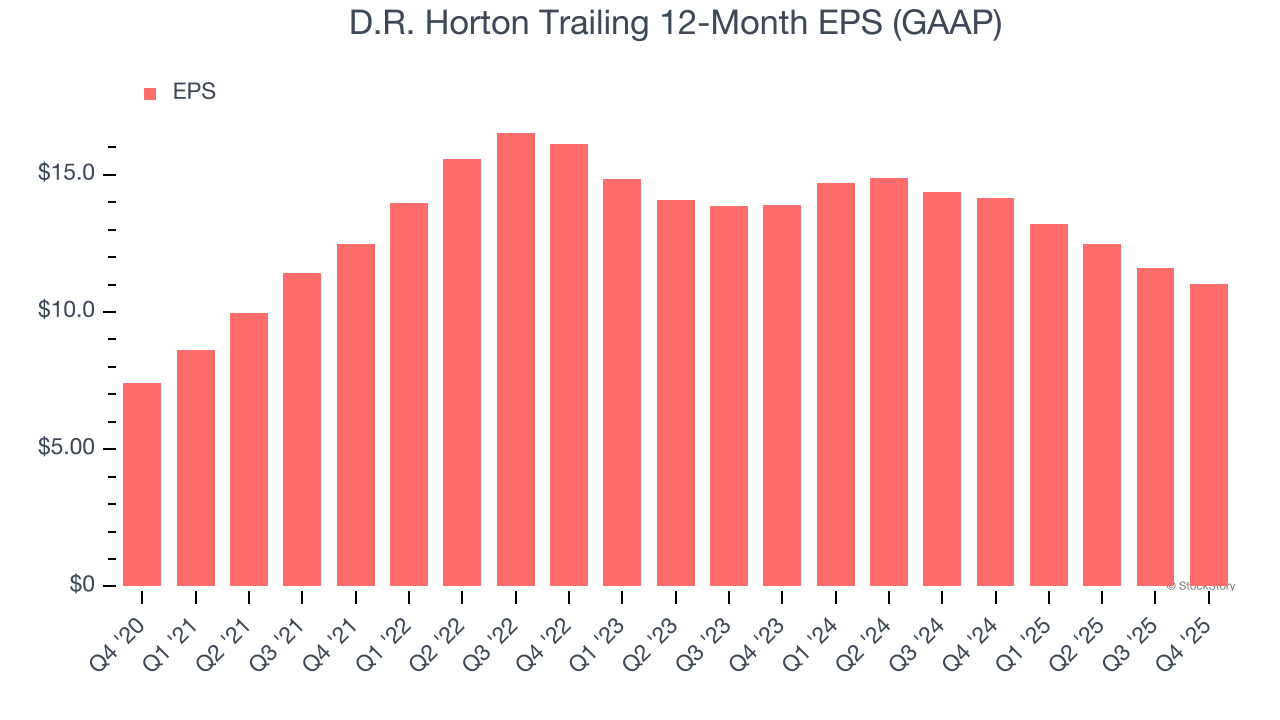
Like with revenue, we analyze EPS over a more recent period because it can provide insight into an emerging theme or development for the business.
D.R. Horton’s two-year annual EPS declines of 11% were bad and lower than its two-year revenue losses.
Diving into the nuances of D.R. Horton’s earnings can give us a better understanding of its performance. D.R. Horton’s operating margin has declined over the last two years. This was the most relevant factor (aside from the revenue impact) behind its lower earnings; interest expenses and taxes can also affect EPS but don’t tell us as much about a company’s fundamentals.
In Q4, D.R. Horton reported EPS of $2.03, down from $2.61 in the same quarter last year. Despite falling year on year, this print beat analysts’ estimates by 5.9%. Over the next 12 months, Wall Street expects D.R. Horton’s full-year EPS of $11.02 to grow 4.3%.
We enjoyed seeing D.R. Horton beat analysts’ revenue expectations this quarter. We were also glad its EPS outperformed Wall Street’s estimates. On the other hand, its backlog missed. Overall, this was still a solid quarter. The stock traded up 1.7% to $158.55 immediately after reporting.
Is D.R. Horton an attractive investment opportunity right now? The latest quarter does matter, but not nearly as much as longer-term fundamentals and valuation, when deciding if the stock is a buy. We cover that in our actionable full research report which you can read here (it’s free).
| Apr-25 | |
| Apr-23 | |
| Apr-22 | |
| Apr-22 | |
| Apr-21 | |
| Apr-21 | |
| Apr-21 | |
| Apr-21 | |
| Apr-21 | |
| Apr-21 | |
| Apr-21 | |
| Apr-21 | |
| Apr-21 | |
| Apr-21 | |
| Apr-21 |
Join thousands of traders who make more informed decisions with our premium features. Real-time quotes, advanced visualizations, alerts, and much more.
Learn more about Finviz Elite