|
|
|

|
|||||
|
|
|
Cenovus Energy Inc. CVE is closing in on its 52-week high of $18.75, finishing the most recent session at $17.68. While the stock’s steady rise has coincided with recent upward movement in commodity prices, the move appears to be driven by much more than macroeconomic tailwinds.
Strong operational execution, visible production growth and a disciplined capital framework have positioned Cenovus as one of the more compelling stories in the Canadian energy space. As the stock approaches a technical milestone, investors are increasingly asking whether CVE has the fundamentals to push positively into new high ground.
Before addressing that question, it is worth stepping back to examine what is driving the company’s momentum beneath the surface.
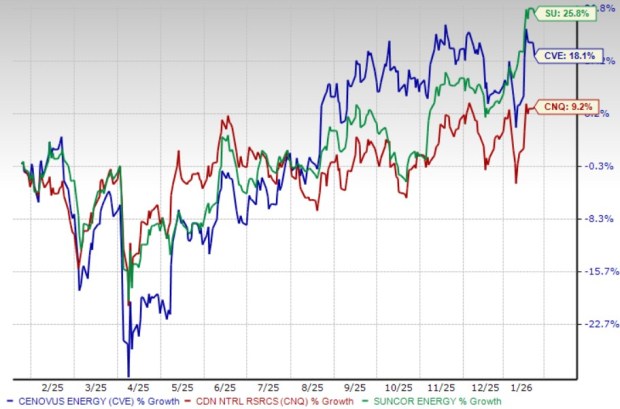
The broader Canadian energy sector has enjoyed a constructive backdrop over the past year. However, Cenovus’ positioning remains distinctive. Over the past year, CVE shares have risen 18.1%, outperforming Canadian Natural Resources Limited’s CNQ 9.2% rally, though trailing Suncor Energy’s SU 25.8% growth. Still, CVE’s performance becomes more compelling when viewed in the context of consistent earnings delivery, a deep and scalable resource base and improving cash flow visibility.
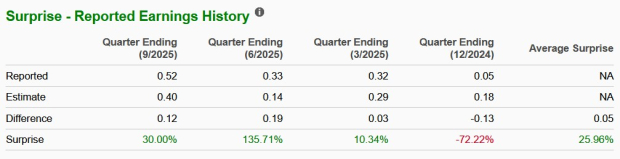
Adding to this constructive setup, Cenovus has beaten the Zacks Consensus Estimate in three of the last four quarters and missed the same once, posting an impressive average earnings surprise of 25.96%. In a sector often defined by volatility and uneven execution, that level of consistency stands out. It reinforces a narrative centered on operational traction, production growth, improving mix and the buildout of meaningful free cash flow leverage.
Cenovus’ growth outlook is secured by a portfolio of sanctioned, ongoing projects that support production rising to more than 1 million BOE/d by 2027-2028, without reliance on large, unapproved developments. The company has guided production to 965 MBOE/d in 2026, with growth driven by assets already under construction.
Key contributors include the Christina Lake North expansion (expected to add 40 Mbbls/d by the end of 2028) and the Sunrise optimization program (projected to deliver 15-20 Mbbls/d of incremental production between 2024 and 2028). Offshore, the West White Rose project represents a meaningful catalyst, with first oil anticipated in the second quarter of 2026 and net production expected to reach 45 thousand barrels per day by 2028. Together, these projects improve Cenovus’ scale and enhance medium-term cash flow visibility.
The acquisition of MEG Energy marks a strategic inflection point for Cenovus, materially strengthening its oil sands portfolio by consolidating contiguous, high-quality SAGD assets in the Christina Lake region. The transaction adds approximately 110 Mbbls/d of low-cost production and is expected to be immediately accretive to adjusted funds flow and free funds flow per share in the first full year following closing.
Management has identified pre-tax synergies of $150 million in 2026, with expectations that these benefits will grow to more than $400 million annually by 2028. These gains are largely tied to operating, development and commercial efficiencies that align closely with Cenovus’ existing operating model. The company expects to realize these synergies while keeping net debt below 1X adjusted funds flow.
Cenovus’ 2026 plan signals a transition away from a heavier growth-spending phase toward volume ramp-ups and reliability-focused execution. Key catalysts include West White Rose first oil in the second quarter of 2026 and ramping volumes at Foster Creek.
Capital spending is expected to be C$5-C$5.3 billion, inclusive of planned turnarounds. This framework suggests a balanced approach that prioritizes sustaining operations while advancing selective, high-return growth projects. If Cenovus executes as planned, the combination of higher upstream volumes, steady downstream utilization and disciplined cost control should support stronger free funds flow generation through the cycle.
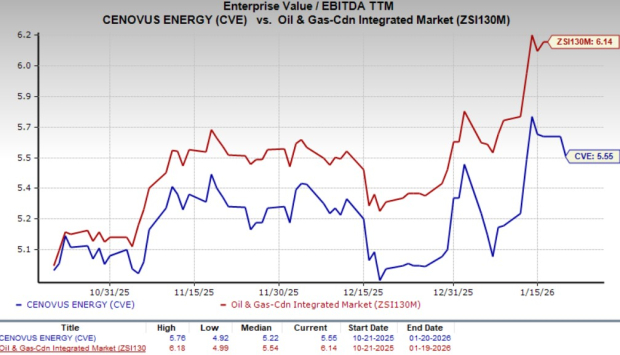
From a valuation standpoint, Cenovus currently trades at a trailing 12-month EV/EBITDA multiple of 5.55X, which is below the broader industry average of 6.14X. The stock also trades at a discount to Canadian Natural Resources, which trades at 6.1X EV/EBITDA, and is broadly in line with Suncor Energy at 5.51X. This relative undervaluation suggests that the market has yet to fully price in Cenovus’ improving cashflow profile, leaving room for multiple expansion as fundamentals continue to improve.
As Cenovus moves closer to its 52-week high, the rise is being supported by steady production growth, improving cash flow and a clear capital return plan.
The Zacks Rank #1 (Strong Buy) company continues to trade at an attractive valuation relative to the broader energy sector and the key Canadian peers. This valuation gap underscores a meaningful opportunity, as the company’s improving cash flow visibility, disciplined capital allocation and expanding scale are not yet fully priced into the stock.
You can seethe complete list of today’s Zacks #1 Rank stocks here.
Want the latest recommendations from Zacks Investment Research? Today, you can download 7 Best Stocks for the Next 30 Days. Click to get this free report
This article originally published on Zacks Investment Research (zacks.com).
| Jul-14 | |
| Jun-26 | |
| Jun-05 | |
| Jun-05 | |
| May-28 | |
| May-11 | |
| May-08 | |
| May-07 | |
| May-07 | |
| May-07 | |
| May-07 | |
| May-06 | |
| May-06 | |
| May-05 | |
| May-05 |
Join thousands of traders who make more informed decisions with our premium features. Real-time quotes, advanced visualizations, alerts, and much more.
Learn more about Finviz Elite