|
|
|

|
|||||
|
|
|
Las Vegas Sands Corp. (NYSE:LVS) attracted plenty of eyeballs recently but not for good reasons. Although the casino and resorts giant delivered an earnings beat, profitability concerns tied to the company's Macao unit sparked a massive sell-off in LVS stock. Still, even with the carnage, the footprint of smart money traders reveals that they're paying a premium for upside optionality.
For the fourth quarter, Las Vegas Sands posted adjusted earnings per share of 85 cents, beating Wall Street's consensus target of 76 cents. In addition, the entertainment giant rang up sales of $3.649 billion, exceeding the forecast of $3.328 billion. Ordinarily, such a strong performance likely would have seen LVS stock swing higher, especially against the current challenging economic backdrop.
Unfortunately, investors were fixated on Macao, which represents the swing region for Las Vegas Sands. Market buyers wanted to see margin recovery from this business unit as traffic normalizes. However, EBITDA margin fell by approximately 390 basis points. This print meant that even though the headline revenue beat was strong, profitability per revenue dollar deteriorated.
Granted, the exit from LVS stock reflected fundamental concerns that Macao's mix has shifted away from ultra-high-margin VIP patrons toward a mass market clientele, which is going to drive volume at the expense of higher operating costs. Nevertheless, longer-term positives, such as a growing emphasis on events and entertainment may lead to increased length of stay and spend per visitor.
This forward-looking assessment isn't just speculation but appears to be having a tangible impact on trader sentiment. Volatility skew — which identifies implied volatility (IV) or a stock's potential kinetic output — for the Feb. 20 expiration date shows call option IV priced for upside convexity relative to puts.
In effect, the upward curvature of call IV at both ends of the strike price spectrum reflect the residual impact of actual demand flows filtered through dealer pricing. As such, both the in-the-money (ITM) and out-the-money (OTM) calls reflect various degrees of upside optionality.
Translation? The smart money at the very least recognizes the possibility of a dead-cat bounce.
Now that we know the bias of the smart money, we should next consider the parameters of the trading battlefield. For that, we can turn to the Black-Scholes-derived expected move calculator, which reveals that for the Feb. 20 options chain, LVS stock may range between $48.77 and $55.43. This dispersion represents a 6.39% high-low spread from the current spot price.
Where did this dispersion come from? In its model, Black-Scholes assumes that stock returns are lognormally distributed. Subsequently, if LVS stock were to fall symmetrically within one standard deviation from the spot price (while accounting for volatility and days to expiration), the expected range would be roughly between $49 and $56.
As a quick cheat sheet, what Black-Scholes is really saying is that in 68% of cases, the aforementioned dispersion is what we would expect when the February-month options chain rolls around. However, this calculation only gives us what is possible, not what is probable. To narrow down the list of suspects, we can deploy an inductive second-order analysis using the Markov property.
Under Markov, the future state of a system depends entirely on the current state. In other words, forward probabilities should not be calculated independently but rather assessed under context. To use a simple sports analogy, a 20-yard field goal is an easy chip shot. Add snow, wind and playoff pressure and these odds may change quite dramatically.
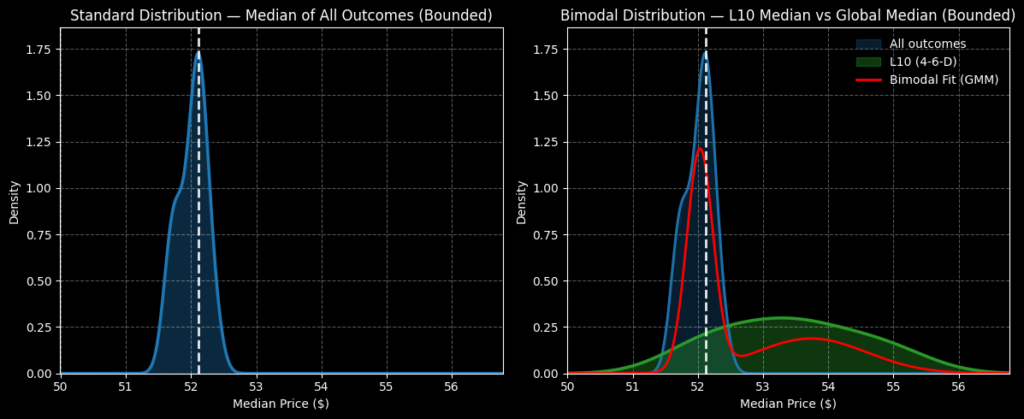
And what is the current context of LVS stock? Heading into the earnings disclosure, LVS had printed only four up weeks in the last 10 weeks, leading to an overall downward slope. Under this 4-6-D condition, we would expect over the next 10 weeks for the security to land between $50 and $57.
Granted, that's not helpful relative to the expected move calculation. However, probability density would likely peak between $53 and $54. Further, much more of the probability mass would likely land north of the current spot price, which helps justify why the smart money is so bullish.
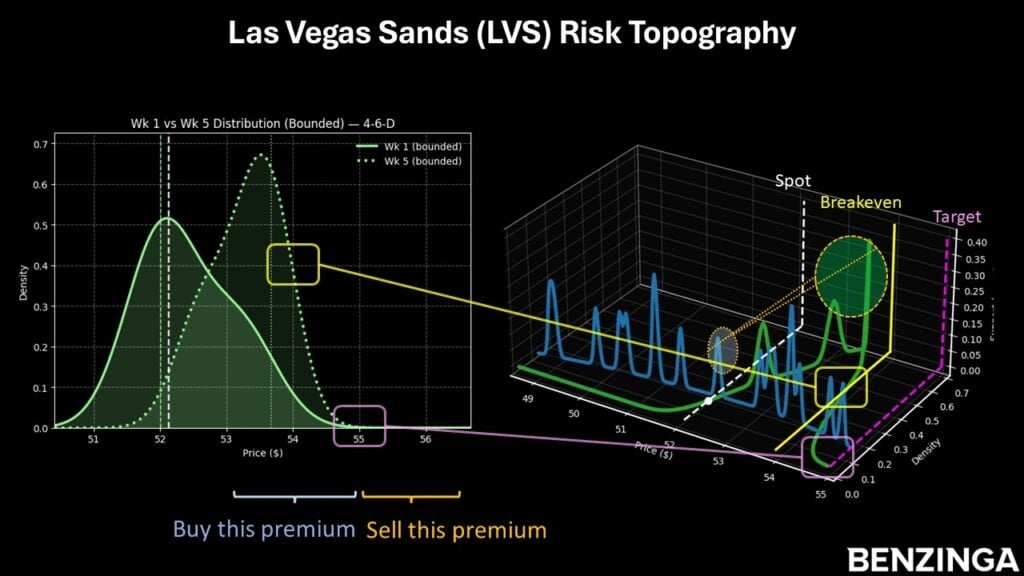
In addition, the forward distributions under 4-6-D conditions between one week and five weeks ahead reflect a statistical tendency of LVS stock reflexively pushing higher following extended downside. While nothing can be guaranteed, speculators have an incentivize to at least consider the contrarian thesis.
There are contrarian wagers where the idea is so bold, so outrageous that only a few people are even remotely entertaining the concept. This isn't one of those ideas. Instead, as the volatility skew demonstrates, the smart money is very much structured to benefit from a dead-cat bounce.
So, if you're looking for cheap call spreads, LVS stock is not your candidate. In fact, the premium is contextually high — even though open-market conviction is so poor — because the most sophisticated market participants are likely anticipating a recovery.
That said, I'm encouraged by the strength in numbers. Therefore, I'm a fan of the 53/55 bull call spread expiring Feb. 20. This wager requires LVS stock to rise through the $55 strike price at expiration, which is a very aggressive target. Indeed, $55 sits at the tail end of the forward distribution curve of the 4-6-D signal.
On the flipside, the statistical tendency to generate reflexively positive responses following extended downturns cannot be ignored. Combined with smart money sentiment, this call spread — which features a breakeven price of $53.96 — offers a potentially rational form of speculation.
The opinions and views expressed in this content are those of the individual author and do not necessarily reflect the views of Benzinga. Benzinga is not responsible for the accuracy or reliability of any information provided herein. This content is for informational purposes only and should not be misconstrued as investment advice or a recommendation to buy or sell any security. Readers are asked not to rely on the opinions or information herein, and encouraged to do their own due diligence before making investing decisions.
Image: Shutterstock
| Jul-23 | |
| Jul-22 | |
| Jul-22 | |
| Jul-21 | |
| Jul-15 | |
| Jul-13 | |
| Jul-10 | |
| Jul-09 | |
| Jul-06 | |
| Jul-01 | |
| Jun-23 | |
| Jun-22 | |
| Jun-16 | |
| Jun-10 | |
| Jun-02 |
Join thousands of traders who make more informed decisions with our premium features. Real-time quotes, advanced visualizations, alerts, and much more.
Learn more about Finviz Elite