|
|
|

|
|||||
|
|
|

Cable, internet, and telephone services provider Charter (NASDAQ:CHTR) missed Wall Street’s revenue expectations in Q4 CY2025, with sales falling 2.3% year on year to $13.6 billion. Its GAAP profit of $10.34 per share was 3.3% above analysts’ consensus estimates.
Is now the time to buy Charter? Find out by accessing our full research report, it’s free.
Operating as Spectrum, Charter (NASDAQ:CHTR) is a leading telecommunications company offering cable television, high-speed internet, and voice services across the United States.
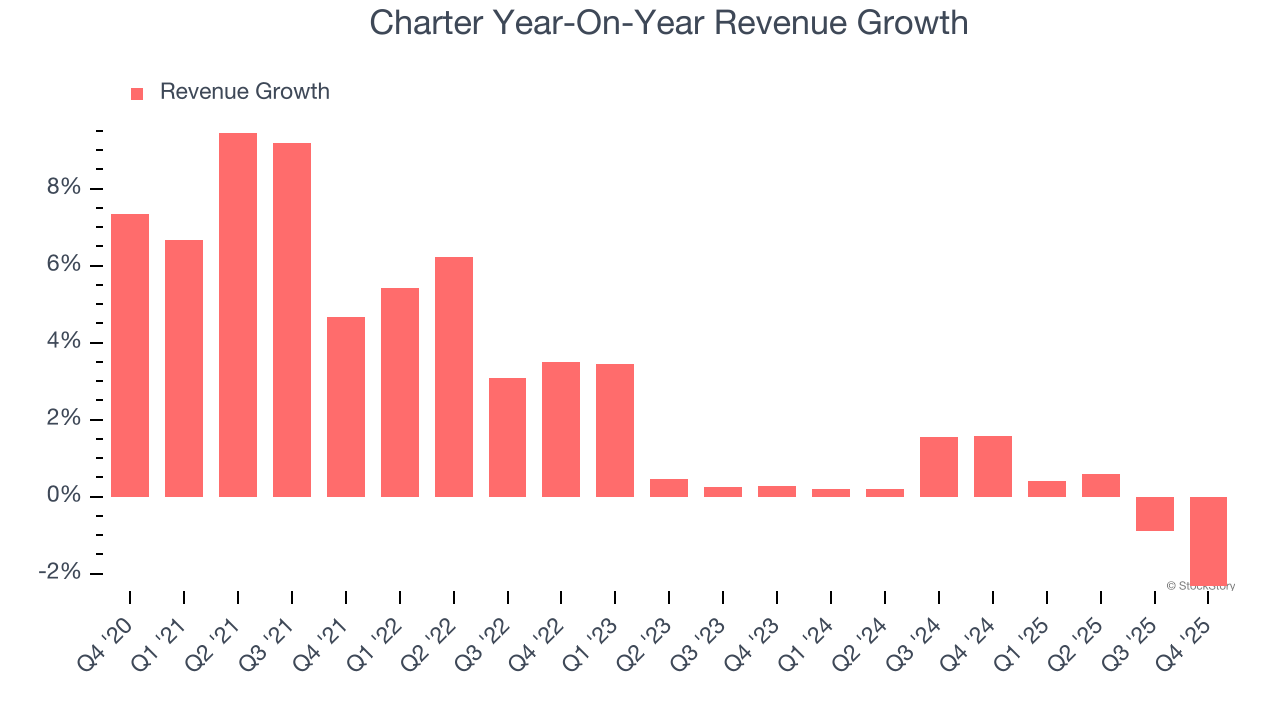
A company’s long-term sales performance is one signal of its overall quality. Any business can experience short-term success, but top-performing ones enjoy sustained growth for years. Unfortunately, Charter’s 2.6% annualized revenue growth over the last five years was weak. This fell short of our benchmarks and is a rough starting point for our analysis.
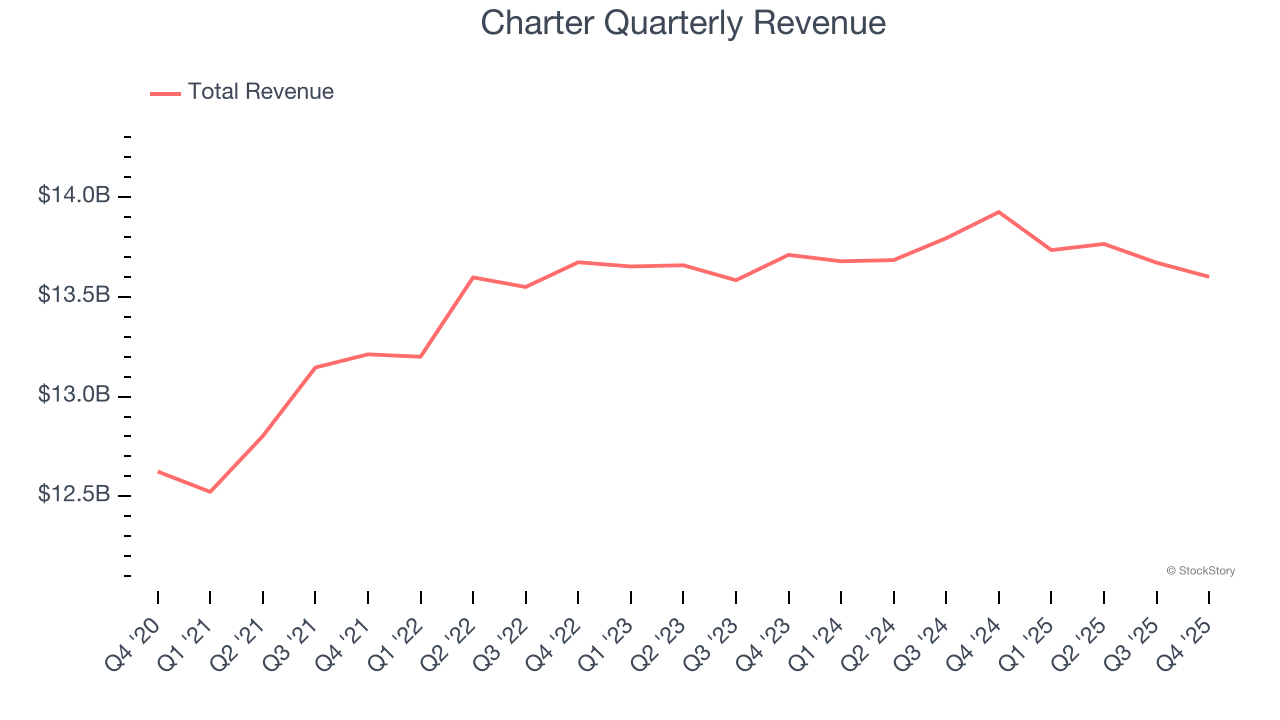
Long-term growth is the most important, but within consumer discretionary, product cycles are short and revenue can be hit-driven due to rapidly changing trends and consumer preferences. Charter’s recent performance shows its demand has slowed as its revenue was flat over the last two years.
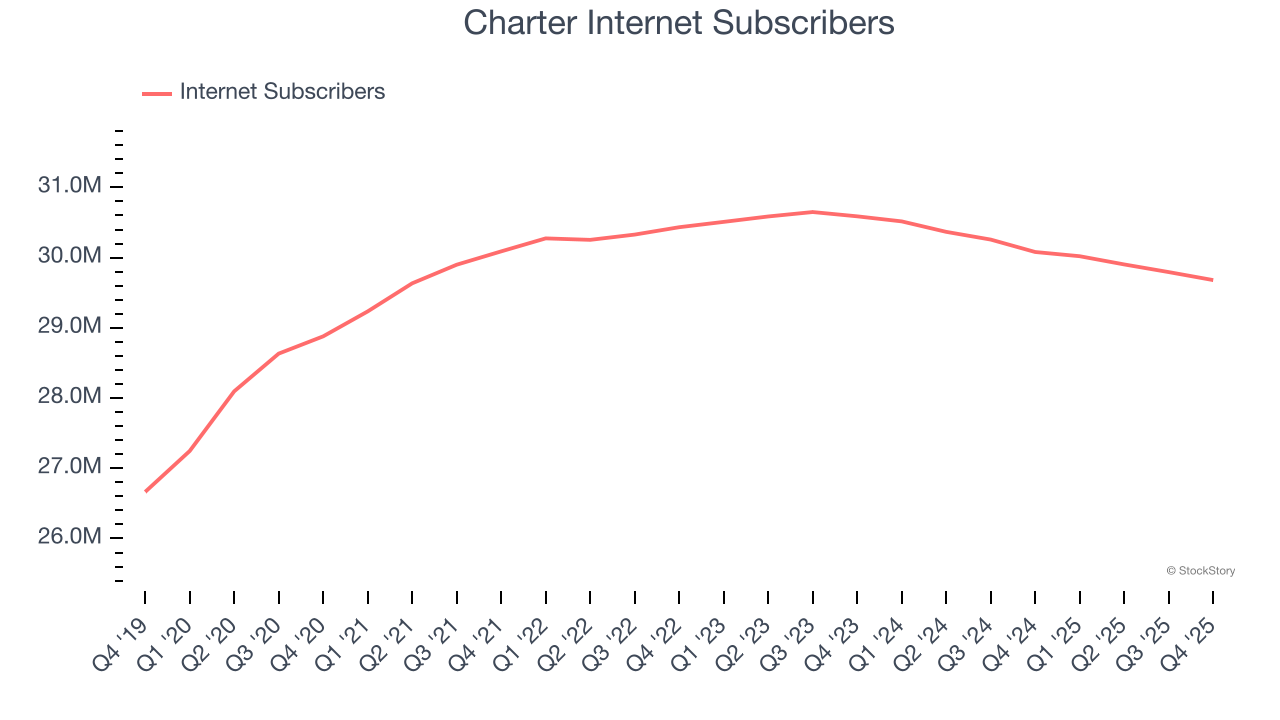
We can dig further into the company’s revenue dynamics by analyzing its number of internet subscribers and video subscribers, which clocked in at 29.68 million and 12.61 million in the latest quarter. Over the last two years, Charter’s internet subscribers averaged 1.2% year-on-year declines while its video subscribers averaged 6.7% year-on-year declines.
This quarter, Charter missed Wall Street’s estimates and reported a rather uninspiring 2.3% year-on-year revenue decline, generating $13.6 billion of revenue.
Looking ahead, sell-side analysts expect revenue to remain flat over the next 12 months. This projection is underwhelming and indicates its newer products and services will not accelerate its top-line performance yet.
The 1999 book Gorilla Game predicted Microsoft and Apple would dominate tech before it happened. Its thesis? Identify the platform winners early. Today, enterprise software companies embedding generative AI are becoming the new gorillas. a profitable, fast-growing enterprise software stock that is already riding the automation wave and looking to catch the generative AI next.
Charter’s operating margin might fluctuated slightly over the last 12 months but has generally stayed the same, averaging 23.7% over the last two years. This profitability was lousy for a consumer discretionary business and caused by its suboptimal cost structure.
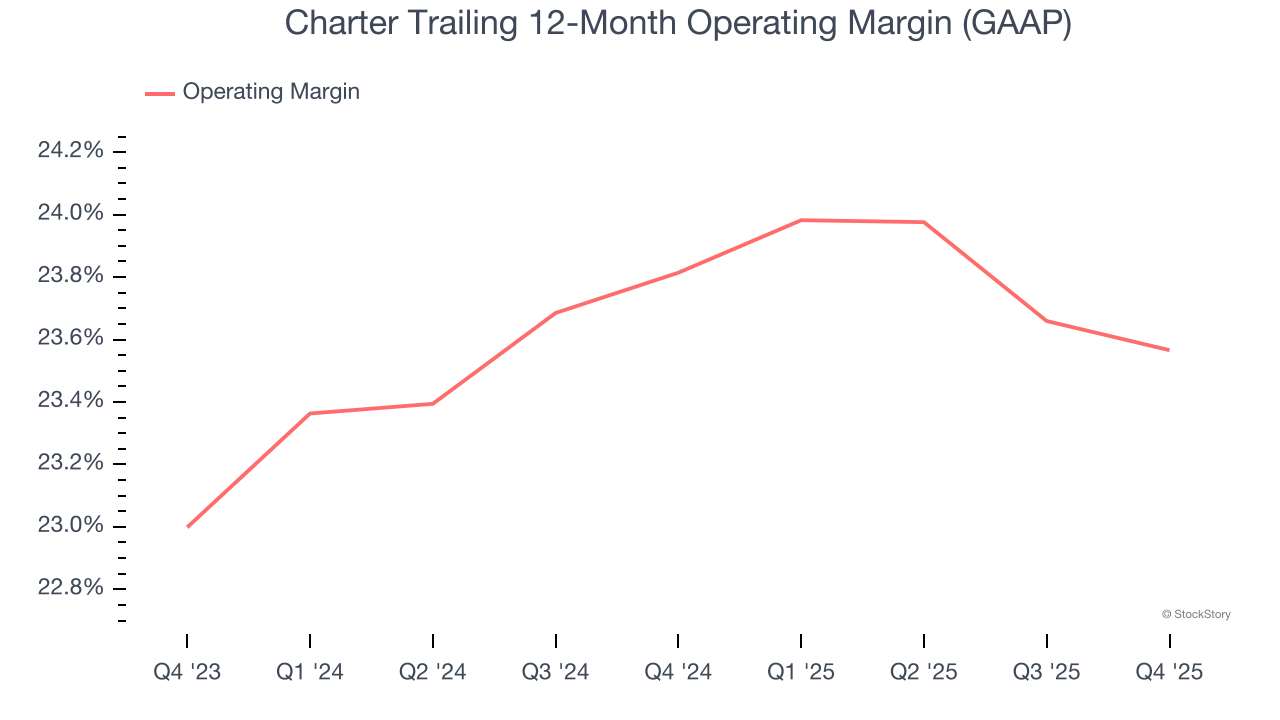
In Q4, Charter generated an operating margin profit margin of 24%, in line with the same quarter last year. This indicates the company’s overall cost structure has been relatively stable.
We track the long-term change in earnings per share (EPS) for the same reason as long-term revenue growth. Compared to revenue, however, EPS highlights whether a company’s growth is profitable.
Charter’s EPS grew at a weak 18.9% compounded annual growth rate over the last five years. On the bright side, this performance was better than its 2.6% annualized revenue growth and tells us the company became more profitable on a per-share basis as it expanded.
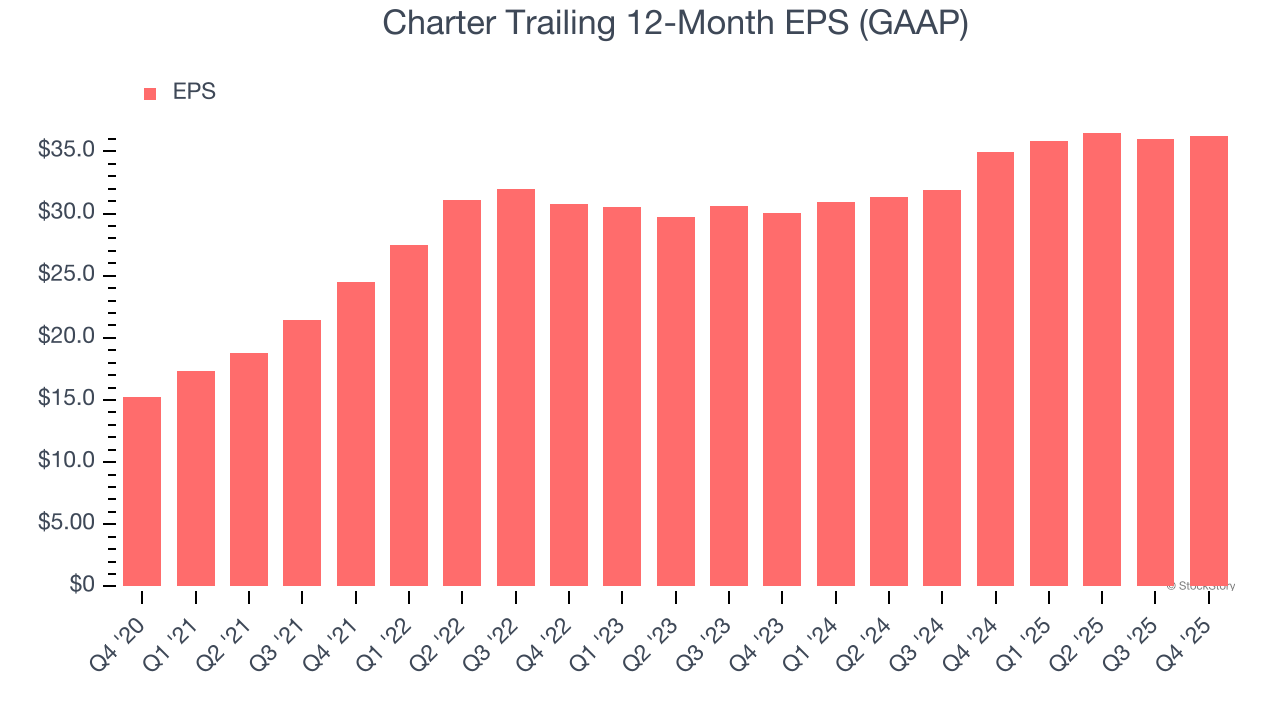
In Q4, Charter reported EPS of $10.34, up from $10.09 in the same quarter last year. This print beat analysts’ estimates by 4.6%. Over the next 12 months, Wall Street expects Charter’s full-year EPS of $36.28 to grow 18.4%.
Although revenue missed slightly, all-important internet subscribers met expectations. Furthermore, EBITDA and EPS both beat. Overall, this was a decent quarter. The stock traded up 6% to $203 immediately after reporting.
So do we think Charter is an attractive buy at the current price? What happened in the latest quarter matters, but not as much as longer-term business quality and valuation, when deciding whether to invest in this stock. We cover that in our actionable full research report which you can read here (it’s free).
| Jun-08 | |
| Jun-05 | |
| Jun-03 | |
| May-28 | |
| May-18 | |
| May-18 | |
| May-15 | |
| May-14 | |
| May-14 | |
| May-13 | |
| May-07 | |
| May-05 | |
| May-04 | |
| May-04 | |
| Apr-29 |
Join thousands of traders who make more informed decisions with our premium features. Real-time quotes, advanced visualizations, alerts, and much more.
Learn more about Finviz Elite