|
|
|

|
|||||
|
|
|

Freight Delivery Company ArcBest (NASDAQ:ARCB) beat Wall Street’s revenue expectations in Q4 CY2025, but sales fell by 2.9% year on year to $972.7 million. Its non-GAAP profit of $0.36 per share was 13.8% below analysts’ consensus estimates.
Is now the time to buy ArcBest? Find out by accessing our full research report, it’s free.
“2025 was a year of strong execution and meaningful progress for ArcBest,” said Seth Runser, ArcBest President and CEO.
Historically owning furniture, banking, and other subsidiaries, ArcBest (NASDAQ:ARCB) offers full-truckload, less-than-truckload, and intermodal deliveries of freight.
A company’s long-term performance is an indicator of its overall quality. Even a bad business can shine for one or two quarters, but a top-tier one grows for years. Unfortunately, ArcBest’s 6.4% annualized revenue growth over the last five years was mediocre. This was below our standard for the industrials sector and is a poor baseline for our analysis.
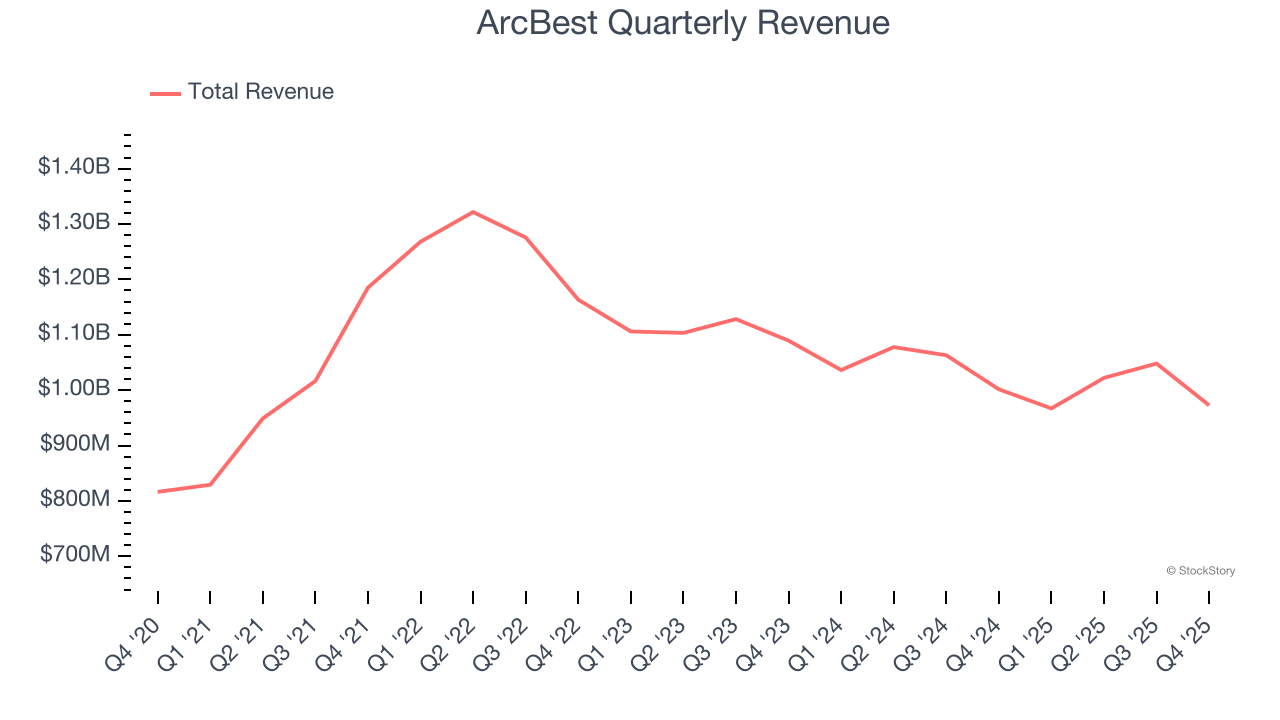
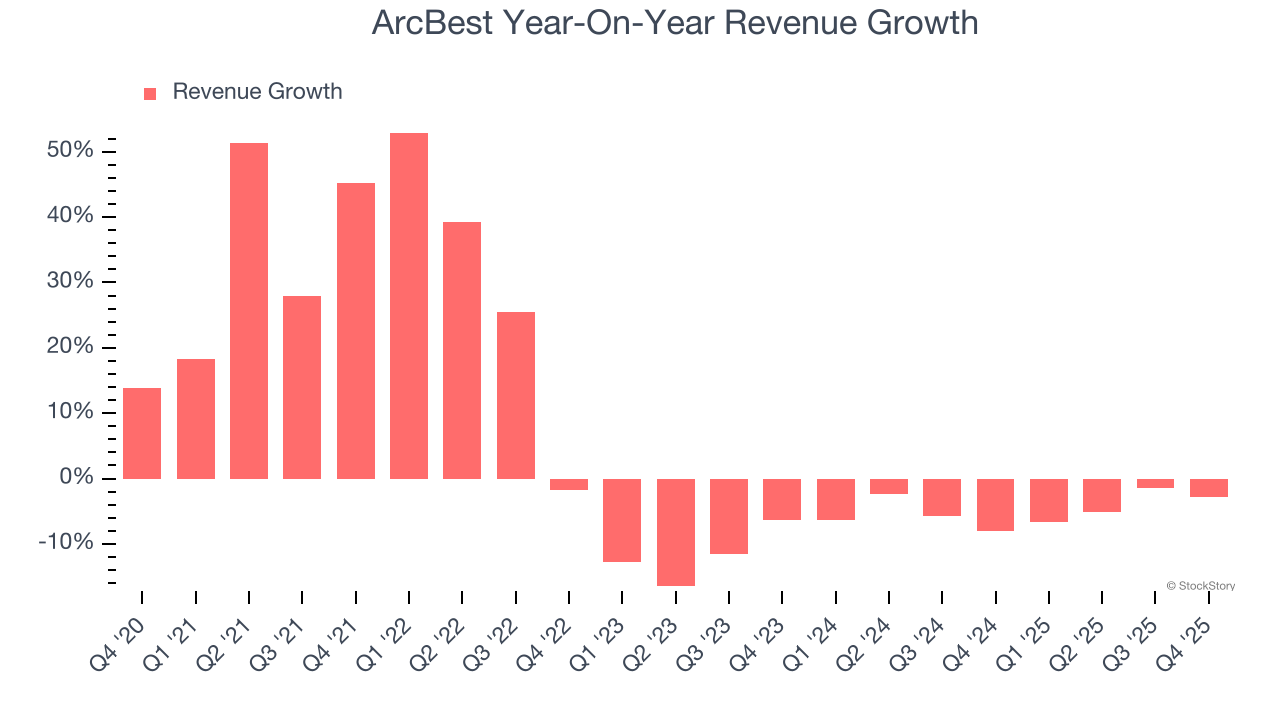
Long-term growth is the most important, but within industrials, a half-decade historical view may miss new industry trends or demand cycles. ArcBest’s performance shows it grew in the past but relinquished its gains over the last two years, as its revenue fell by 4.8% annually.
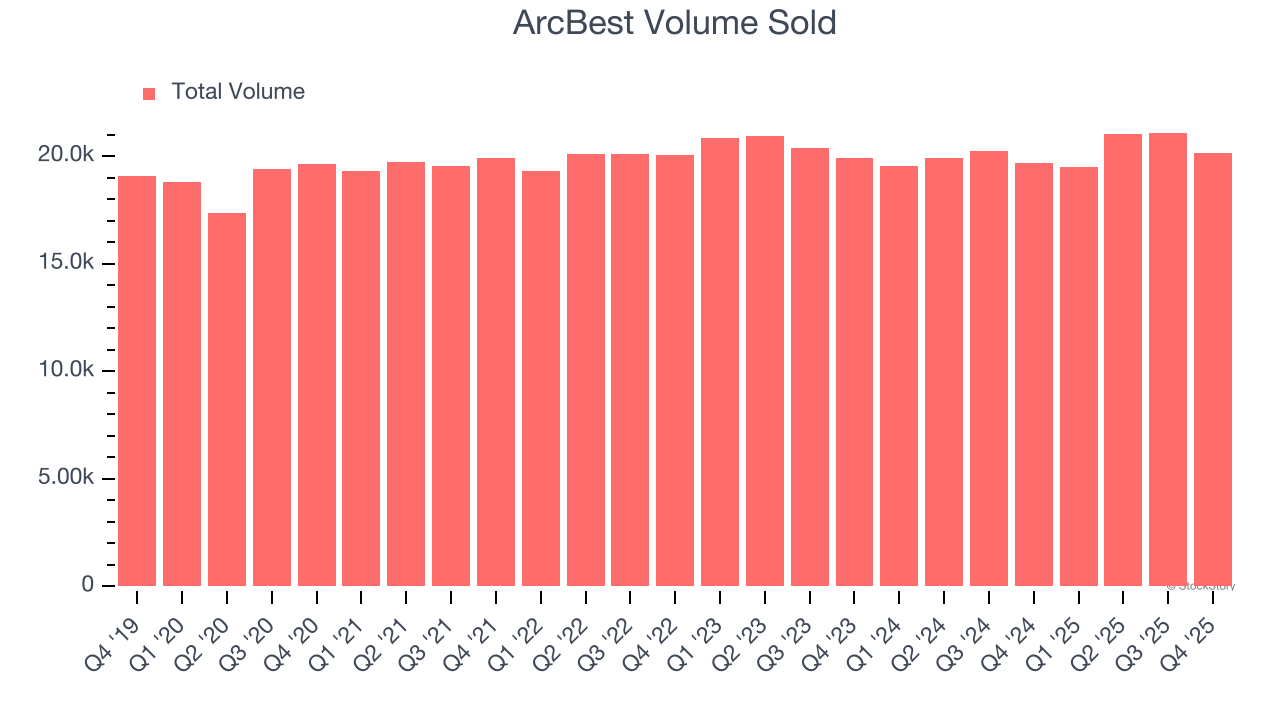
We can better understand the company’s revenue dynamics by analyzing its number of units sold, which reached 20,163 in the latest quarter. Over the last two years, ArcBest’s units sold were flat. Because this number is better than its revenue growth, we can see the company’s average selling price decreased.
This quarter, ArcBest’s revenue fell by 2.9% year on year to $972.7 million but beat Wall Street’s estimates by 0.5%.
Looking ahead, sell-side analysts expect revenue to grow 3.1% over the next 12 months. Although this projection suggests its newer products and services will catalyze better top-line performance, it is still below the sector average.
The 1999 book Gorilla Game predicted Microsoft and Apple would dominate tech before it happened. Its thesis? Identify the platform winners early. Today, enterprise software companies embedding generative AI are becoming the new gorillas. a profitable, fast-growing enterprise software stock that is already riding the automation wave and looking to catch the generative AI next.
ArcBest was profitable over the last five years but held back by its large cost base. Its average operating margin of 5.5% was weak for an industrials business. This result isn’t too surprising given its low gross margin as a starting point.
Looking at the trend in its profitability, ArcBest’s operating margin decreased by 4.8 percentage points over the last five years. This raises questions about the company’s expense base because its revenue growth should have given it leverage on its fixed costs, resulting in better economies of scale and profitability. ArcBest’s performance was poor no matter how you look at it - it shows that costs were rising and it couldn’t pass them onto its customers.
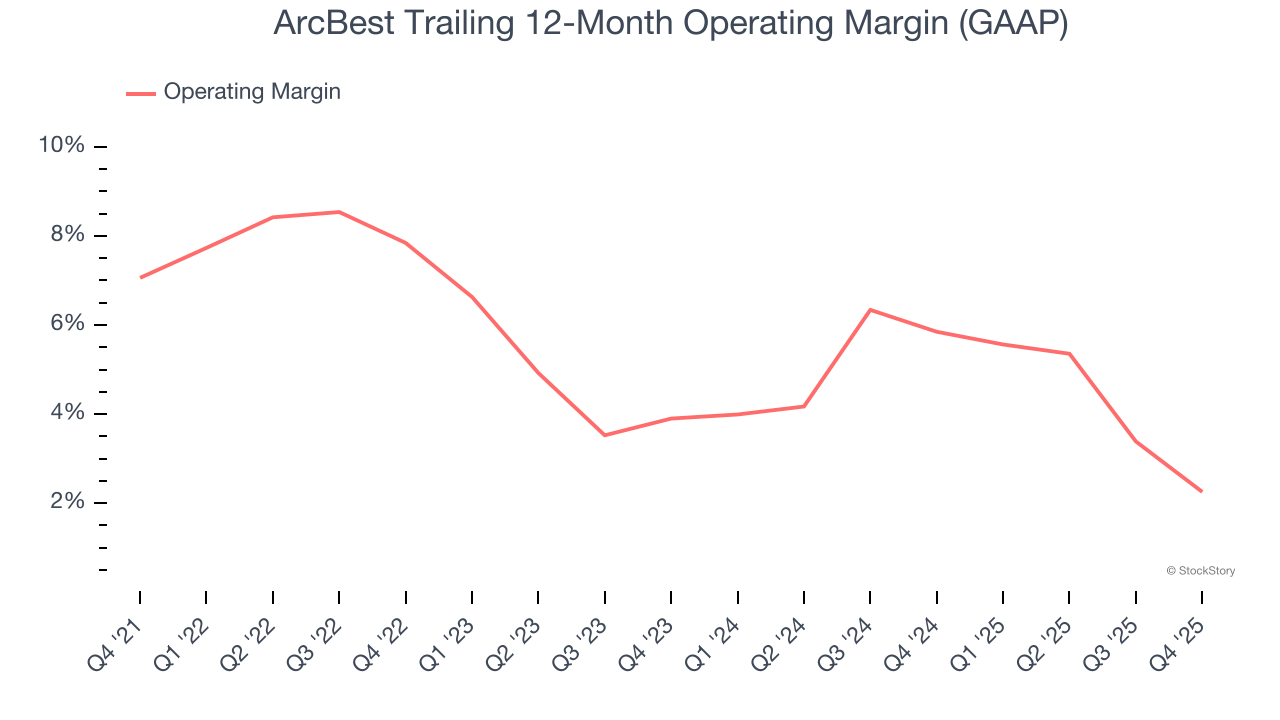
This quarter, ArcBest’s breakeven margin was down 4.7 percentage points year on year. The contraction shows it was less efficient because its expenses increased relative to its revenue.
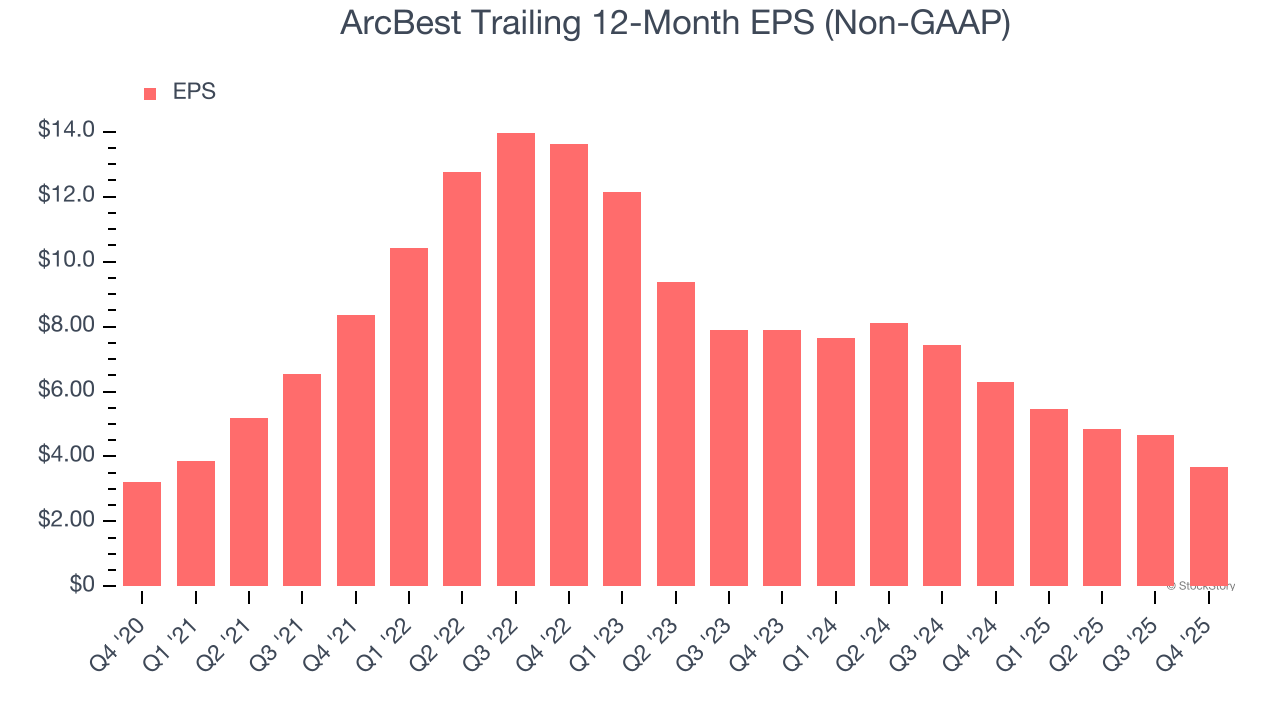
We track the long-term change in earnings per share (EPS) for the same reason as long-term revenue growth. Compared to revenue, however, EPS highlights whether a company’s growth is profitable.
ArcBest’s EPS grew at a weak 2.8% compounded annual growth rate over the last five years, lower than its 6.4% annualized revenue growth. This tells us the company became less profitable on a per-share basis as it expanded due to non-fundamental factors such as interest expenses and taxes.
We can take a deeper look into ArcBest’s earnings to better understand the drivers of its performance. As we mentioned earlier, ArcBest’s operating margin declined by 4.8 percentage points over the last five years. This was the most relevant factor (aside from the revenue impact) behind its lower earnings; interest expenses and taxes can also affect EPS but don’t tell us as much about a company’s fundamentals.
Like with revenue, we analyze EPS over a shorter period to see if we are missing a change in the business.
For ArcBest, its two-year annual EPS declines of 31.7% show it’s continued to underperform. These results were bad no matter how you slice the data.
In Q4, ArcBest reported adjusted EPS of $0.36, down from $1.33 in the same quarter last year. This print missed analysts’ estimates. Over the next 12 months, Wall Street expects ArcBest’s full-year EPS of $3.69 to grow 30.2%.
It was good to see ArcBest narrowly top analysts’ revenue expectations this quarter. On the other hand, its EBITDA missed and its EPS fell short of Wall Street’s estimates. Overall, this quarter could have been better. The stock remained flat at $85.30 immediately after reporting.
ArcBest’s latest earnings report disappointed. One quarter doesn’t define a company’s quality, so let’s explore whether the stock is a buy at the current price. The latest quarter does matter, but not nearly as much as longer-term fundamentals and valuation, when deciding if the stock is a buy. We cover that in our actionable full research report which you can read here (it’s free).
| Jul-09 | |
| Jul-01 | |
| Jun-23 | |
| Jun-12 | |
| Jun-11 | |
| Jun-10 | |
| Jun-08 | |
| Jun-08 | |
| Jun-05 | |
| May-27 | |
| May-27 | |
| May-14 | |
| Apr-29 | |
| Apr-28 | |
| Apr-28 |
Join thousands of traders who make more informed decisions with our premium features. Real-time quotes, advanced visualizations, alerts, and much more.
Learn more about Finviz Elite