|
|
|

|
|||||
|
|
|

Electronics manufacturing services provider Benchmark (NYSE:BHE) reported revenue ahead of Wall Streets expectations in Q4 CY2025, with sales up 7.2% year on year to $704.3 million. Guidance for next quarter’s revenue was better than expected at $675 million at the midpoint, 1.8% above analysts’ estimates. Its non-GAAP profit of $0.71 per share was 10.9% above analysts’ consensus estimates.
Is now the time to buy Benchmark? Find out by accessing our full research report, it’s free.
“I am proud of our team’s performance in 2025, culminating in the fourth quarter’s high single-digit revenue growth and EPS growth at more than double that rate,” said Jeff Benck, Benchmark’s CEO.
Operating as a critical behind-the-scenes partner for complex technology products since 1979, Benchmark Electronics (NYSE:BHE) provides advanced manufacturing, engineering, and technology solutions for original equipment manufacturers across aerospace, medical, industrial, and technology sectors.
Examining a company’s long-term performance can provide clues about its quality. Any business can have short-term success, but a top-tier one grows for years.
With $2.66 billion in revenue over the past 12 months, Benchmark is a mid-sized business services company, which sometimes brings disadvantages compared to larger competitors benefiting from better economies of scale. On the bright side, it can still flex high growth rates because it’s working from a smaller revenue base.
As you can see below, Benchmark’s sales grew at a decent 5.3% compounded annual growth rate over the last five years. This shows its offerings generated slightly more demand than the average business services company, a useful starting point for our analysis.
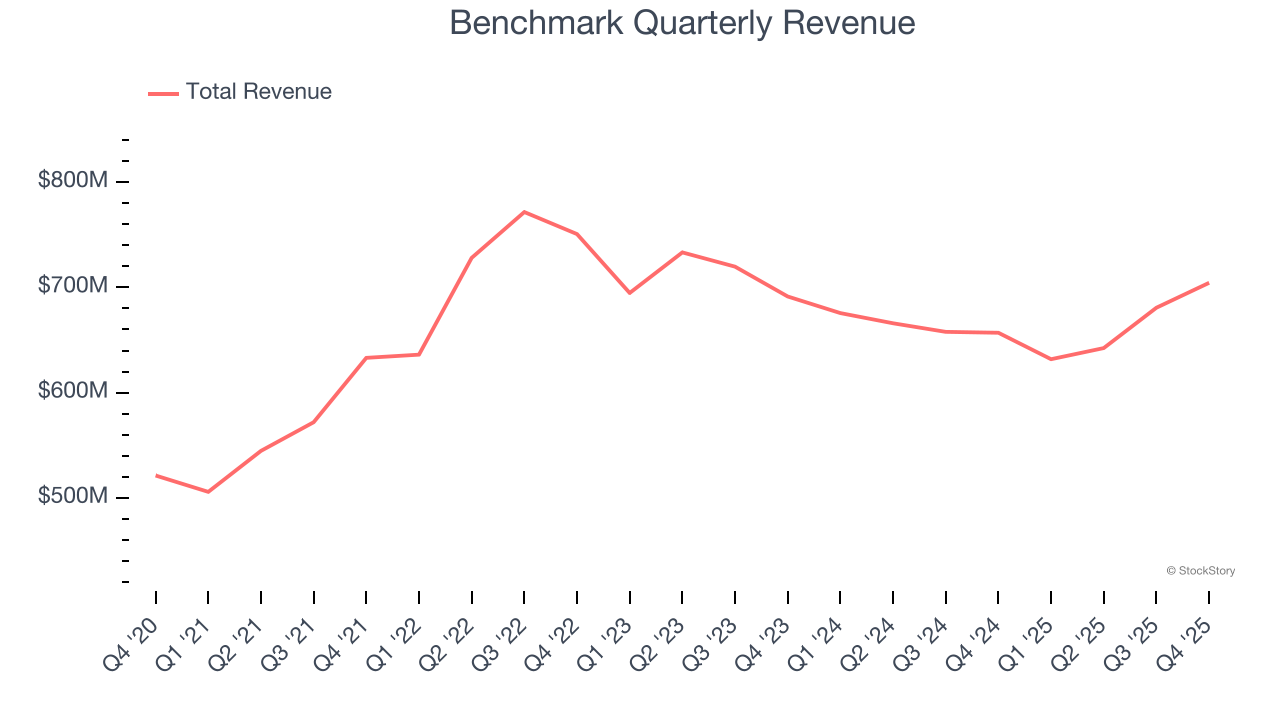
We at StockStory place the most emphasis on long-term growth, but within business services, a half-decade historical view may miss recent innovations or disruptive industry trends. Benchmark’s recent performance marks a sharp pivot from its five-year trend as its revenue has shown annualized declines of 3.2% over the last two years.
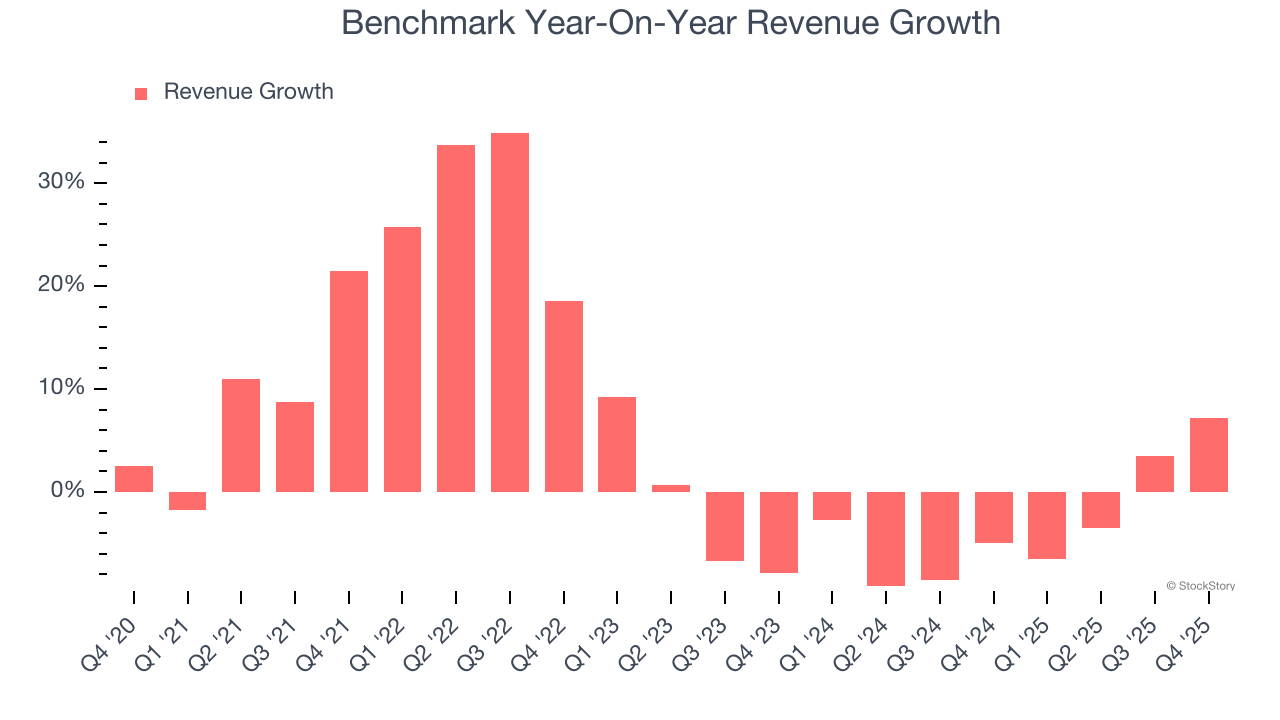
This quarter, Benchmark reported year-on-year revenue growth of 7.2%, and its $704.3 million of revenue exceeded Wall Street’s estimates by 1.1%. Company management is currently guiding for a 6.8% year-on-year increase in sales next quarter.
Looking further ahead, sell-side analysts expect revenue to grow 4.6% over the next 12 months. While this projection suggests its newer products and services will fuel better top-line performance, it is still below the sector average.
While Wall Street chases Nvidia at all-time highs, an under-the-radar semiconductor supplier is dominating a critical AI component these giants can’t build without. Click here to access our free report one of our favorites growth stories.
Benchmark’s operating margin might fluctuated slightly over the last 12 months but has remained more or less the same, averaging 3.7% over the last five years. This profitability was lousy for a business services business and caused by its suboptimal cost structure.
Analyzing the trend in its profitability, Benchmark’s operating margin might fluctuated slightly but has generally stayed the same over the last five years. This raises questions about the company’s expense base because its revenue growth should have given it leverage on its fixed costs, resulting in better economies of scale and profitability.
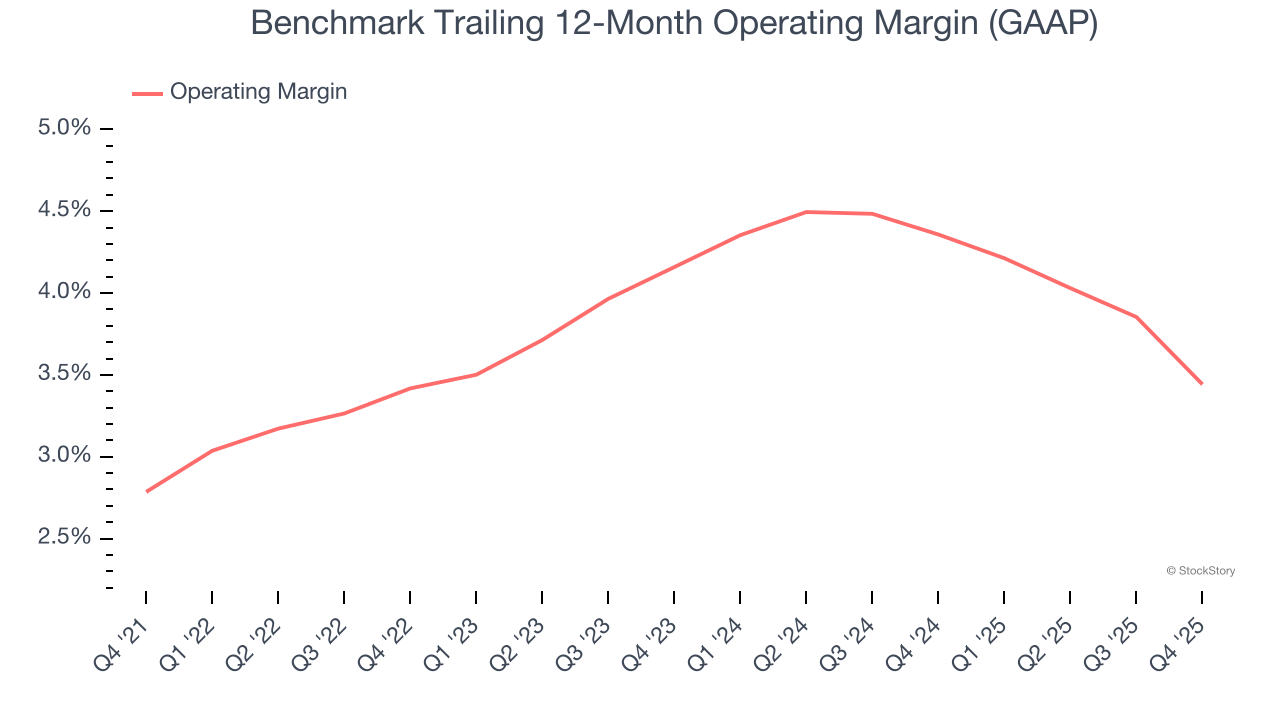
In Q4, Benchmark generated an operating margin profit margin of 2.9%, down 1.6 percentage points year on year. This reduction is quite minuscule and indicates the company’s overall cost structure has been relatively stable.
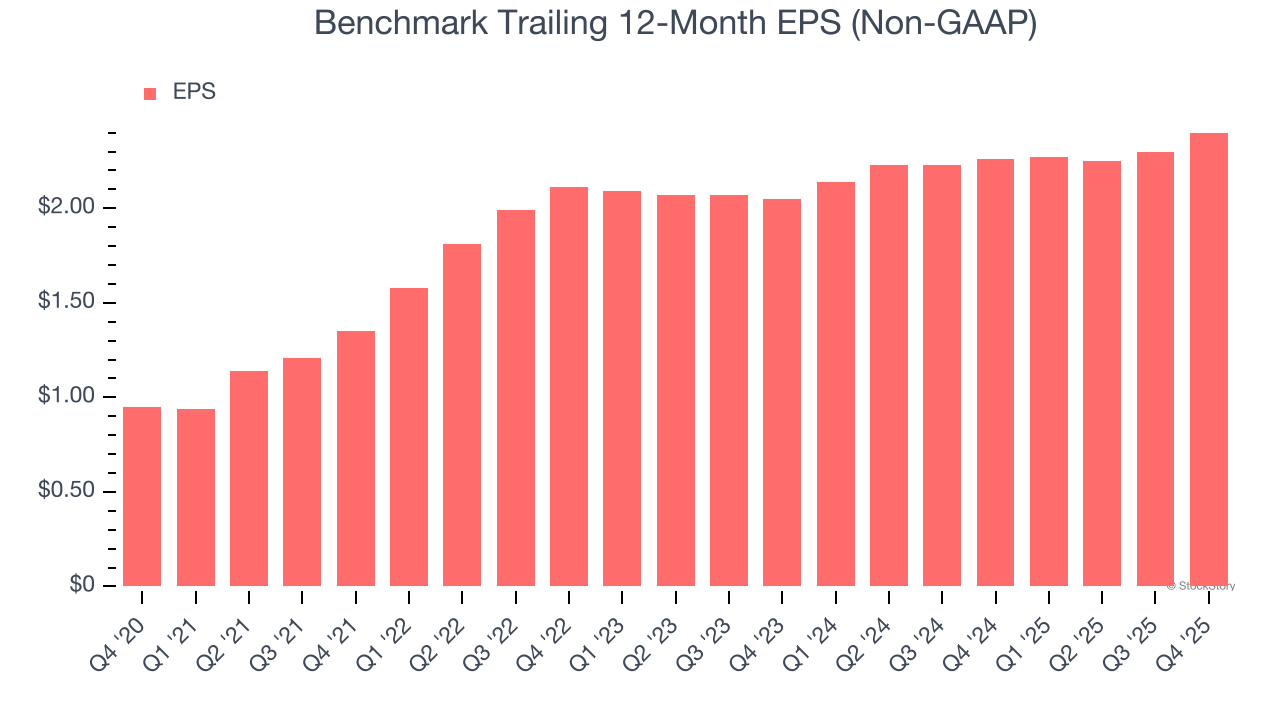
We track the long-term change in earnings per share (EPS) for the same reason as long-term revenue growth. Compared to revenue, however, EPS highlights whether a company’s growth is profitable.
Benchmark’s EPS grew at an astounding 20.4% compounded annual growth rate over the last five years, higher than its 5.3% annualized revenue growth. However, this alone doesn’t tell us much about its business quality because its operating margin didn’t improve.
Like with revenue, we analyze EPS over a more recent period because it can provide insight into an emerging theme or development for the business.
For Benchmark, its two-year annual EPS growth of 8.2% was lower than its five-year trend. We hope its growth can accelerate in the future.
In Q4, Benchmark reported adjusted EPS of $0.71, up from $0.61 in the same quarter last year. This print easily cleared analysts’ estimates, and shareholders should be content with the results. Over the next 12 months, Wall Street expects Benchmark’s full-year EPS of $2.40 to grow 3.6%.
It was great to see Benchmark’s revenue guidance for next quarter top analysts’ expectations. We were also glad its EPS outperformed Wall Street’s estimates. Zooming out, we think this was a good print with some key areas of upside. The stock remained flat at $56.09 immediately after reporting.
So do we think Benchmark is an attractive buy at the current price? When making that decision, it’s important to consider its valuation, business qualities, as well as what has happened in the latest quarter. We cover that in our actionable full research report which you can read here (it’s free).
| Jun-30 | |
| Jun-29 | |
| Jun-17 | |
| Jun-15 | |
| Jun-15 | |
| Jun-08 | |
| Apr-30 | |
| Apr-30 | |
| Apr-29 | |
| Apr-29 | |
| Apr-27 | |
| Apr-15 | |
| Mar-31 | |
| Mar-18 | |
| Mar-16 |
Join thousands of traders who make more informed decisions with our premium features. Real-time quotes, advanced visualizations, alerts, and much more.
Learn more about Finviz Elite