|
|
|

|
|||||
|
|
|

Measurement equipment distributor Transcat (NASDAQ:TRNS) beat Wall Street’s revenue expectations in Q4 CY2025, with sales up 25.6% year on year to $83.86 million. Its non-GAAP profit of $0.26 per share was 17.5% below analysts’ consensus estimates.
Is now the time to buy Transcat? Find out by accessing our full research report, it’s free.
"Transcat delivered strong performance across our entire business portfolio in the fiscal third quarter highlighted by 7% service organic revenue growth*,” commented Lee D. Rudow, President and CEO.
Serving the pharmaceutical, industrial manufacturing, energy, and chemical process industries, Transcat (NASDAQ:TRNS) provides measurement instruments and supplies.
A company’s long-term sales performance can indicate its overall quality. Any business can have short-term success, but a top-tier one grows for years. Thankfully, Transcat’s 13.4% annualized revenue growth over the last five years was excellent. Its growth beat the average industrials company and shows its offerings resonate with customers.
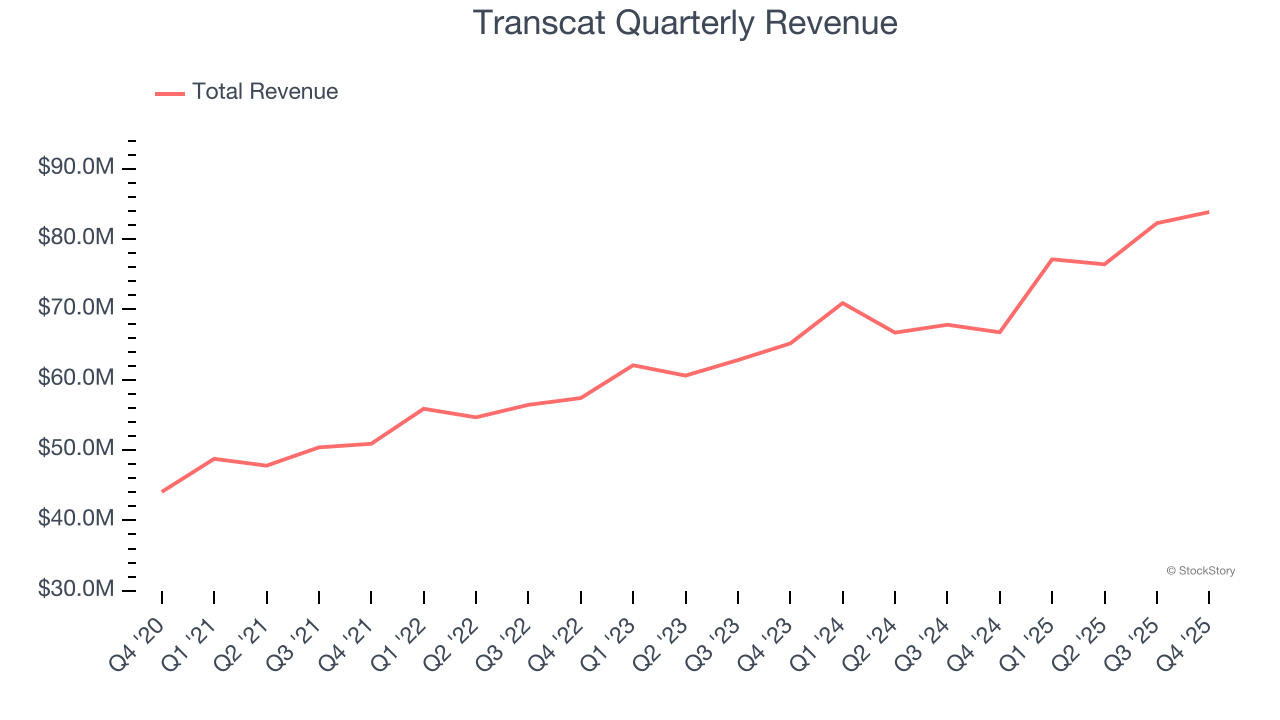
We at StockStory place the most emphasis on long-term growth, but within industrials, a half-decade historical view may miss cycles, industry trends, or a company capitalizing on catalysts such as a new contract win or a successful product line. Transcat’s annualized revenue growth of 12.9% over the last two years aligns with its five-year trend, suggesting its demand was predictably strong.
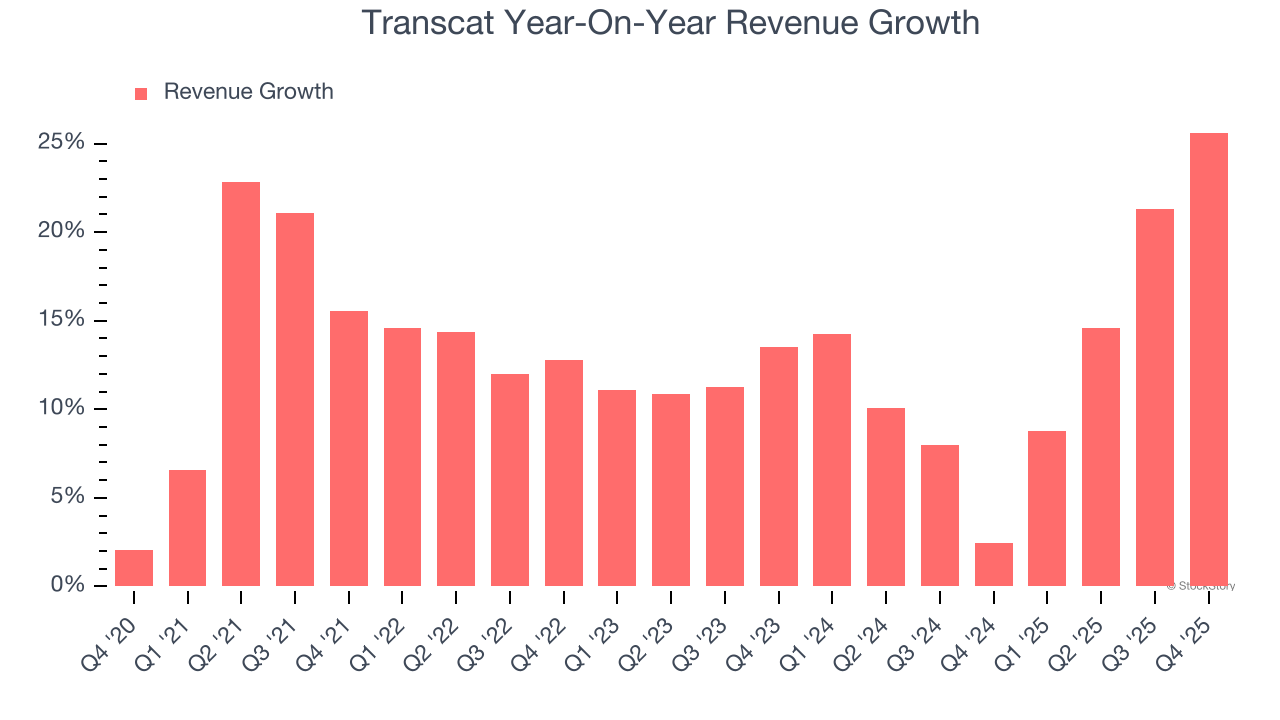
This quarter, Transcat reported robust year-on-year revenue growth of 25.6%, and its $83.86 million of revenue topped Wall Street estimates by 4.1%.
Looking ahead, sell-side analysts expect revenue to grow 8.5% over the next 12 months, a deceleration versus the last two years. Still, this projection is above the sector average and indicates the market sees some success for its newer products and services.
While Wall Street chases Nvidia at all-time highs, an under-the-radar semiconductor supplier is dominating a critical AI component these giants can’t build without. Click here to access our free report one of our favorites growth stories.
Transcat was profitable over the last five years but held back by its large cost base. Its average operating margin of 6.5% was weak for an industrials business.
Looking at the trend in its profitability, Transcat’s operating margin decreased by 3.4 percentage points over the last five years. This raises questions about the company’s expense base because its revenue growth should have given it leverage on its fixed costs, resulting in better economies of scale and profitability. Transcat’s performance was poor no matter how you look at it - it shows that costs were rising and it couldn’t pass them onto its customers.
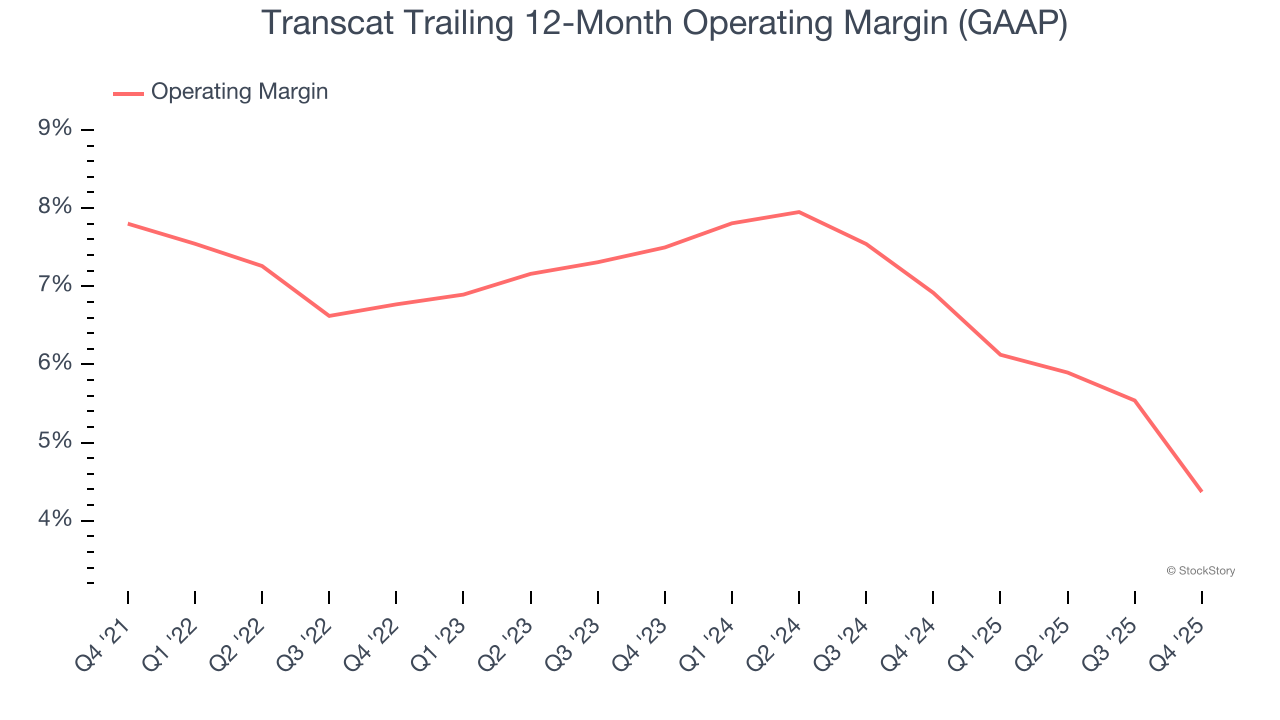
This quarter, Transcat’s breakeven margin was down 4.2 percentage points year on year. Since Transcat’s operating margin decreased more than its gross margin, we can assume it was less efficient because expenses such as marketing, R&D, and administrative overhead increased.
Revenue trends explain a company’s historical growth, but the long-term change in earnings per share (EPS) points to the profitability of that growth – for example, a company could inflate its sales through excessive spending on advertising and promotions.
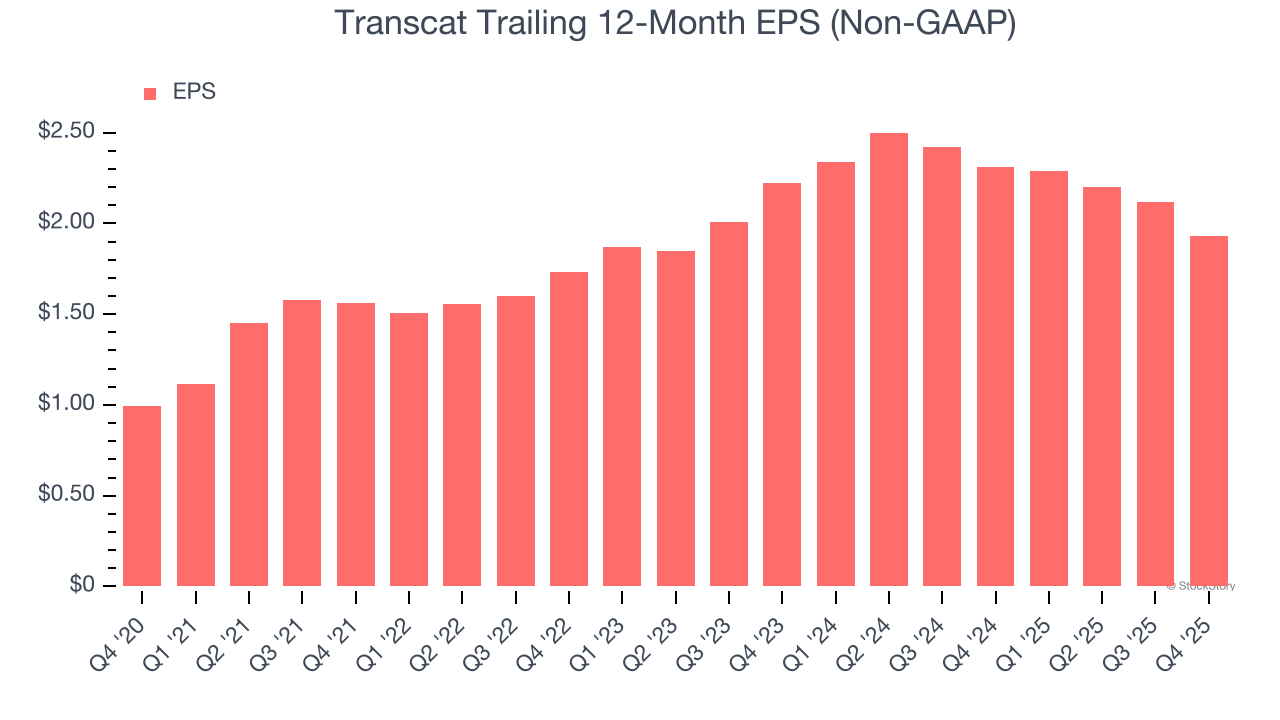
Transcat’s remarkable 14.2% annual EPS growth over the last five years aligns with its revenue performance. This tells us it maintained its per-share profitability as it expanded.
Like with revenue, we analyze EPS over a more recent period because it can provide insight into an emerging theme or development for the business.
Transcat’s two-year annual EPS declines of 6.8% were bad and lower than its 12.9% two-year revenue growth.
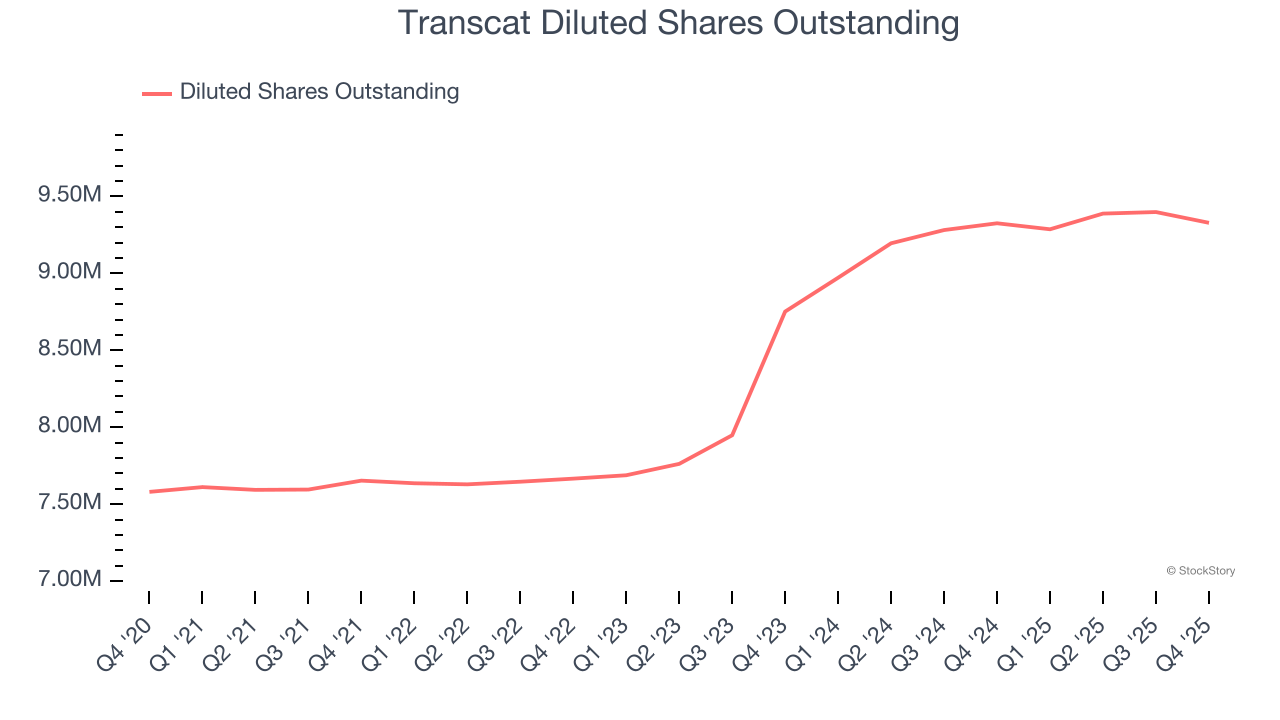
Diving into the nuances of Transcat’s earnings can give us a better understanding of its performance. Transcat’s operating margin has declined over the last two yearswhile its share count has grown 6.6%. This means the company not only became less efficient with its operating expenses but also diluted its shareholders.
In Q4, Transcat reported adjusted EPS of $0.26, down from $0.45 in the same quarter last year. This print missed analysts’ estimates, but we care more about long-term adjusted EPS growth than short-term movements. Over the next 12 months, Wall Street expects Transcat’s full-year EPS of $1.93 to grow 12.2%.
We were impressed by how significantly Transcat blew past analysts’ revenue expectations this quarter. On the other hand, its EBITDA missed and its EPS fell short of Wall Street’s estimates. Overall, this was a softer quarter. The stock remained flat at $63.45 immediately after reporting.
So should you invest in Transcat right now? What happened in the latest quarter matters, but not as much as longer-term business quality and valuation, when deciding whether to invest in this stock. We cover that in our actionable full research report which you can read here (it’s free).
| Jul-16 | |
| Jun-22 | |
| May-27 | |
| May-26 | |
| May-18 | |
| Apr-09 | |
| Mar-09 | |
| Feb-12 | |
| Feb-10 | |
| Feb-06 | |
| Feb-05 | |
| Feb-04 | |
| Feb-04 | |
| Feb-03 | |
| Feb-03 |
Join thousands of traders who make more informed decisions with our premium features. Real-time quotes, advanced visualizations, alerts, and much more.
Learn more about Finviz Elite