|
|
|

|
|||||
|
|
|

Healthcare distributor Cencora (NYSE:COR) missed Wall Street’s revenue expectations in Q4 CY2025, but sales rose 5.5% year on year to $85.93 billion. Its non-GAAP profit of $4.08 per share was 1% above analysts’ consensus estimates.
Is now the time to buy Cencora? Find out by accessing our full research report, it’s free.
“Cencora began fiscal 2026 by delivering strong financial performance and advancing our strategy through the acquisition of OneOncology,” said Robert P. Mauch, President and Chief Executive Officer of Cencora.
Formerly known as AmerisourceBergen until its 2023 rebranding, Cencora (NYSE:COR) is a global pharmaceutical distribution company that connects manufacturers with healthcare providers while offering logistics, data analytics, and consulting services.
Reviewing a company’s long-term sales performance reveals insights into its quality. Any business can put up a good quarter or two, but many enduring ones grow for years. Luckily, Cencora’s sales grew at a decent 10.9% compounded annual growth rate over the last five years. Its growth was slightly above the average healthcare company and shows its offerings resonate with customers.
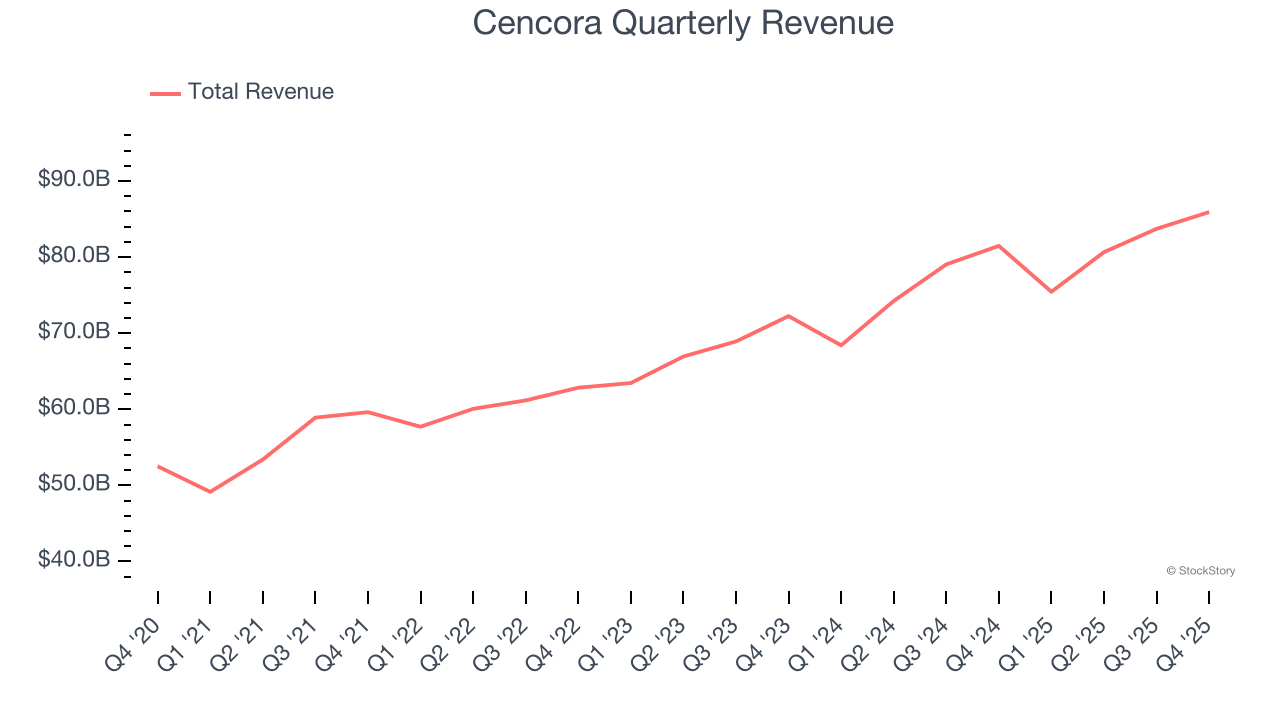
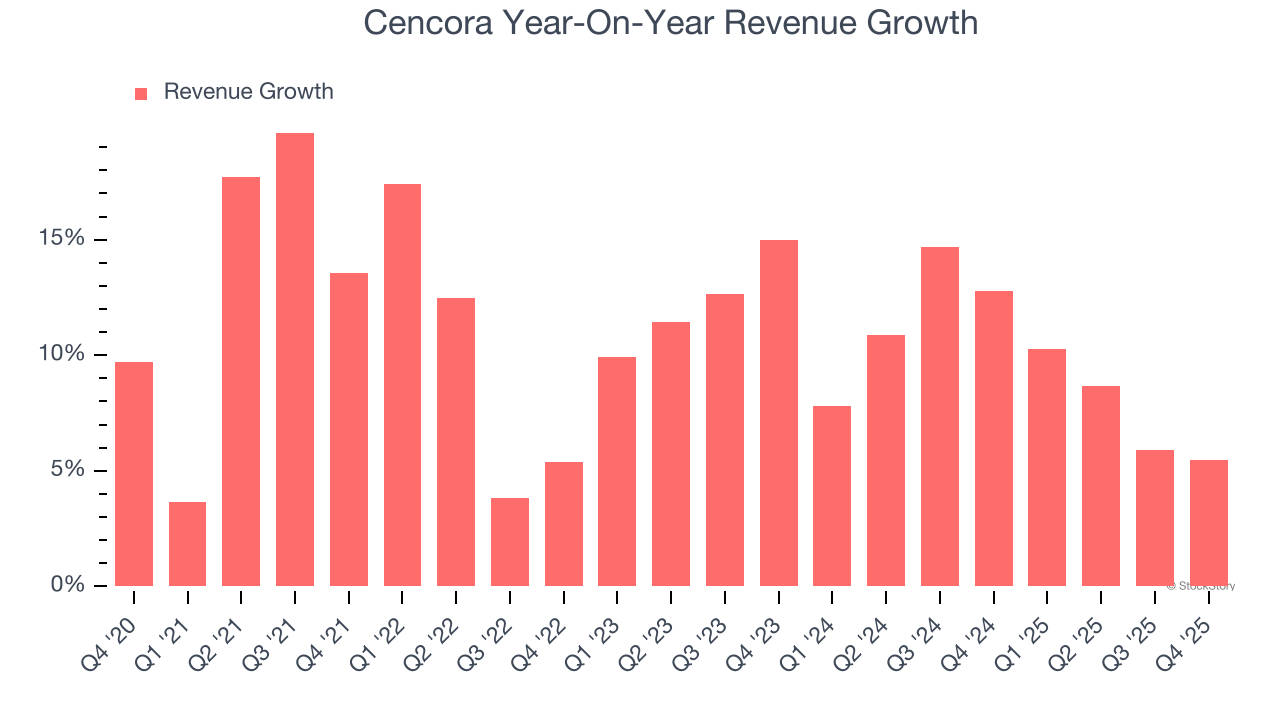
Long-term growth is the most important, but within healthcare, a half-decade historical view may miss new innovations or demand cycles. Cencora’s annualized revenue growth of 9.5% over the last two years is below its five-year trend, but we still think the results were respectable.
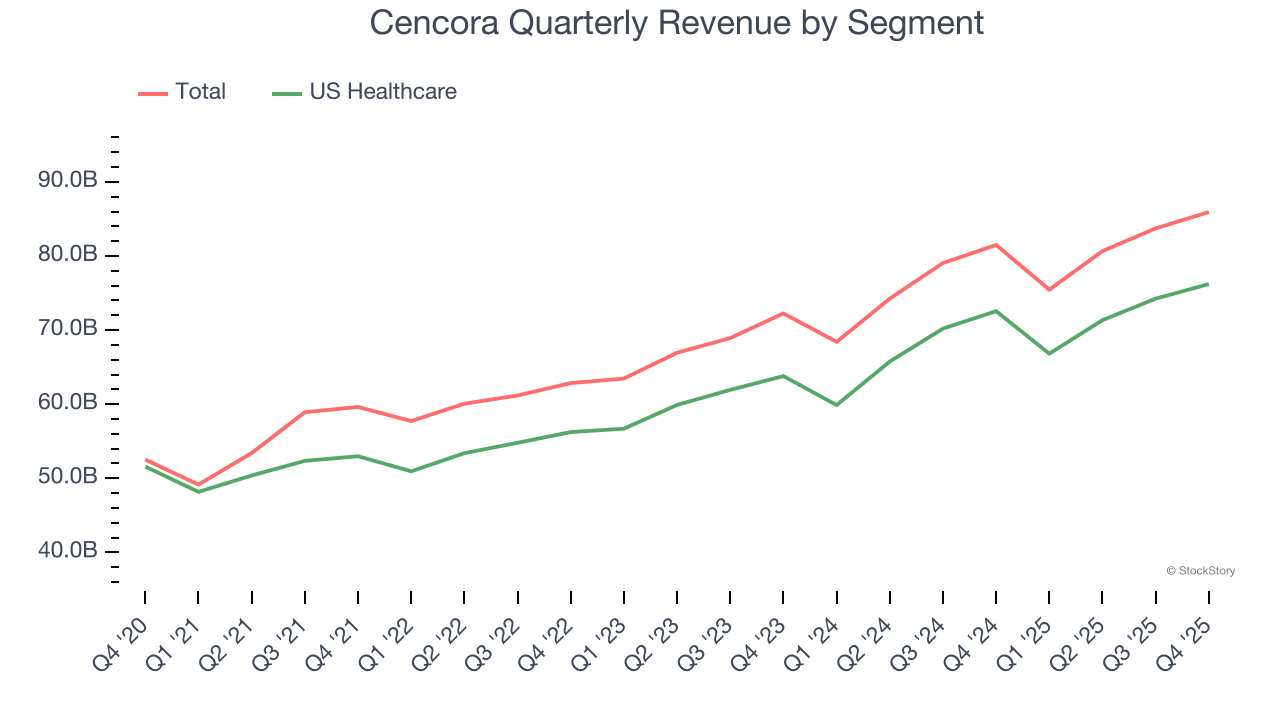
We can better understand the company’s revenue dynamics by analyzing its most important segment, US Healthcare. Over the last two years, Cencora’s US Healthcare revenue averaged 9.2% year-on-year growth.
This quarter, Cencora’s revenue grew by 5.5% year on year to $85.93 billion, missing Wall Street’s estimates.
Looking ahead, sell-side analysts expect revenue to grow 6.4% over the next 12 months, a deceleration versus the last two years. We still think its growth trajectory is satisfactory given its scale and implies the market is baking in success for its products and services.
Software is eating the world and there is virtually no industry left that has been untouched by it. That drives increasing demand for tools helping software developers do their jobs, whether it be monitoring critical cloud infrastructure, integrating audio and video functionality, or ensuring smooth content streaming. Click here to access a free report on our 3 favorite stocks to play this generational megatrend.
Operating margin is a key measure of profitability. Think of it as net income - the bottom line - excluding the impact of taxes and interest on debt, which are less connected to business fundamentals.
Cencora’s operating margin might fluctuated slightly over the last 12 months but has generally stayed the same. The company broke even over the last five years, lousy for a healthcare business. Its large expense base and inefficient cost structure were the main culprits behind this performance.
Looking at the trend in its profitability, Cencora’s operating margin might fluctuated slightly but has generally stayed the same over the last five years. This raises questions about the company’s expense base because its revenue growth should have given it leverage on its fixed costs, resulting in better economies of scale and profitability.
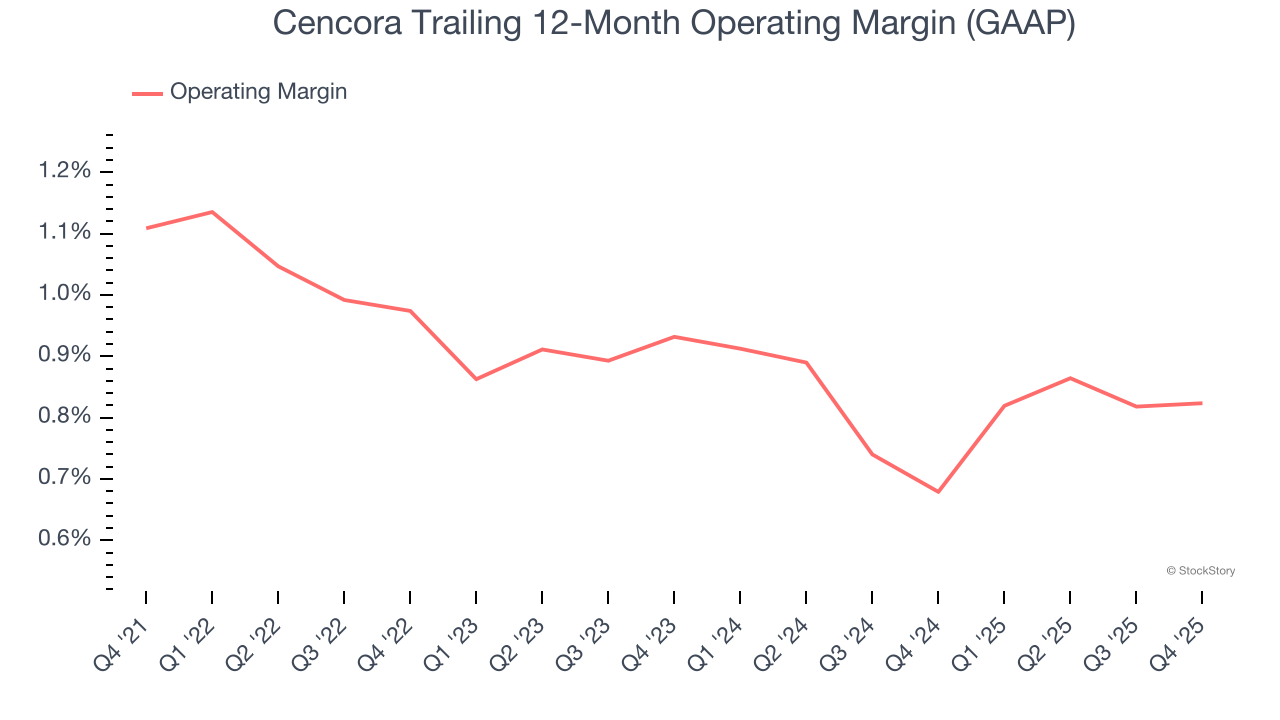
This quarter, Cencora’s breakeven margin was in line with the same quarter last year. This indicates the company’s overall cost structure has been relatively stable.
Revenue trends explain a company’s historical growth, but the long-term change in earnings per share (EPS) points to the profitability of that growth – for example, a company could inflate its sales through excessive spending on advertising and promotions.
Cencora’s EPS grew at a spectacular 14.5% compounded annual growth rate over the last five years, higher than its 10.9% annualized revenue growth. However, this alone doesn’t tell us much about its business quality because its operating margin didn’t improve.
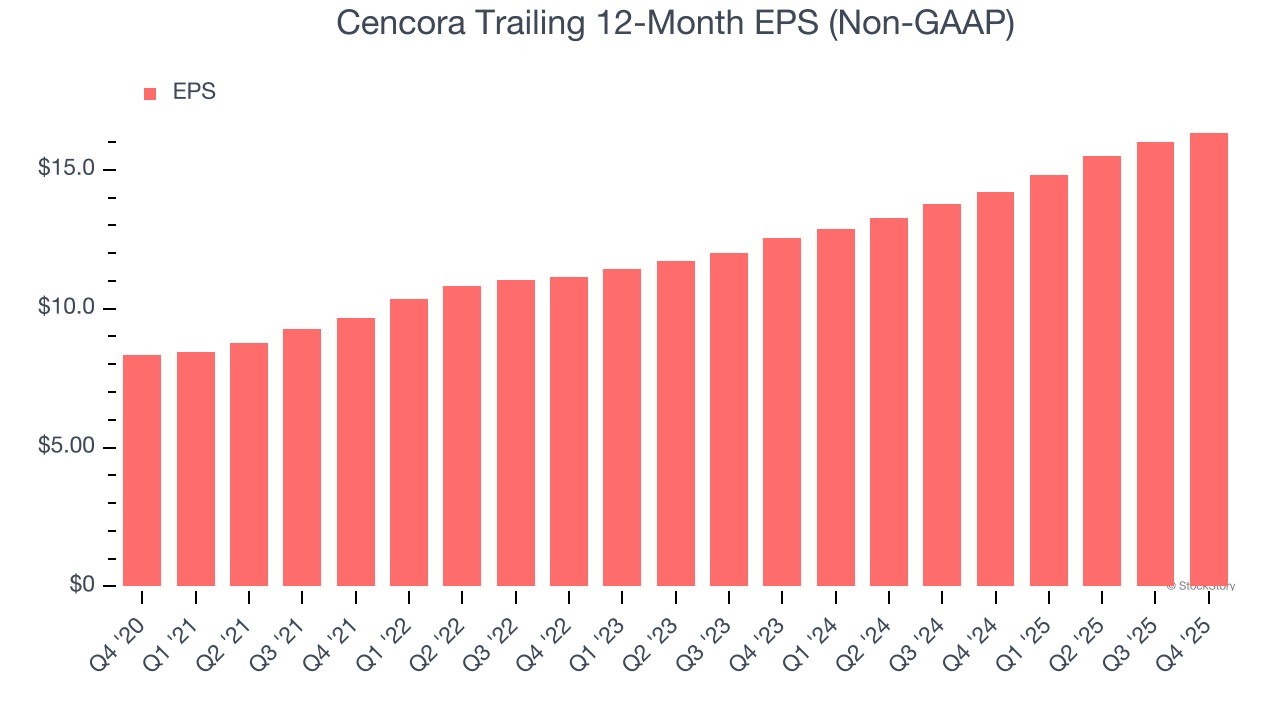
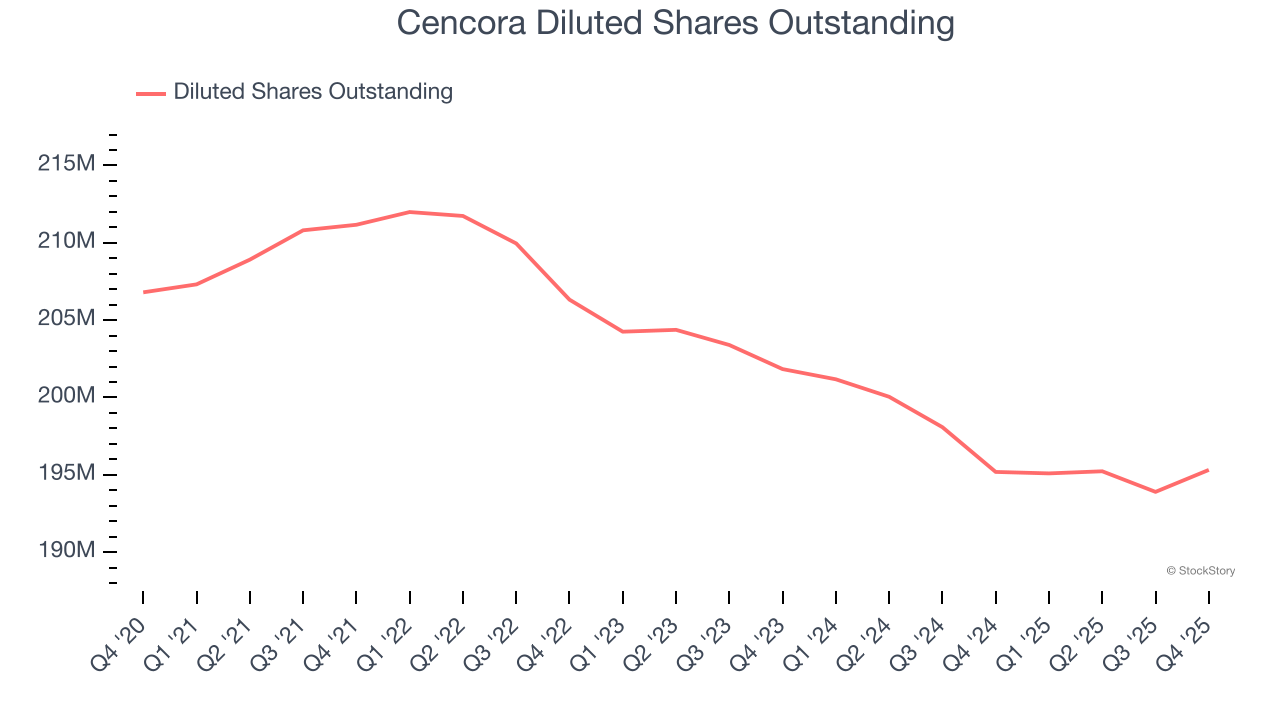
Diving into the nuances of Cencora’s earnings can give us a better understanding of its performance. A five-year view shows that Cencora has repurchased its stock, shrinking its share count by 5.6%. This tells us its EPS outperformed its revenue not because of increased operational efficiency but financial engineering, as buybacks boost per share earnings.
In Q4, Cencora reported adjusted EPS of $4.08, up from $3.73 in the same quarter last year. This print was close to analysts’ estimates. Over the next 12 months, Wall Street expects Cencora’s full-year EPS of $16.34 to grow 10%.
Revenue missed, and this is weighing on shares. While EPS managed to beat, it was still a softer quarter. The stock traded down 3.1% to $350.51 immediately following the results.
Is Cencora an attractive investment opportunity at the current price? If you’re making that decision, you should consider the bigger picture of valuation, business qualities, as well as the latest earnings. We cover that in our actionable full research report which you can read here (it’s free).
| Jul-27 | |
| Jul-09 | |
| Jul-08 | |
| Jul-01 | |
| Jun-15 | |
| May-27 | |
| May-27 | |
| May-21 | |
| May-06 | |
| May-06 | |
| May-06 | |
| Apr-30 | |
| Apr-20 | |
| Apr-01 | |
| Mar-24 |
Join thousands of traders who make more informed decisions with our premium features. Real-time quotes, advanced visualizations, alerts, and much more.
Learn more about Finviz Elite