|
|
|

|
|||||
|
|
|
Global manufacturing solutions provider Flex (NASDAQ:FLEX) reported Q4 CY2025 results topping the market’s revenue expectations, with sales up 7.7% year on year to $7.06 billion. The company expects next quarter’s revenue to be around $6.9 billion, close to analysts’ estimates. Its non-GAAP profit of $0.87 per share was 10.5% above analysts’ consensus estimates.
Is now the time to buy Flex? Find out by accessing our full research report, it’s free.
Revathi Advaithi, CEO of Flex, stated: "Our strong performance continued in the third quarter, with results exceeding our guidance across all metrics. This performance reflects the strength of our diversified business model across industries, including Data Center. As we look ahead, we are confident in our ability to serve as a strategic enabler for our customers as they navigate an increasingly complex and dynamic world."
Originally known as Flextronics until its 2016 rebranding, Flex (NASDAQ:FLEX) is a global manufacturing partner that designs, engineers, and builds products for companies across industries from medical devices to solar trackers.
A company’s long-term sales performance is one signal of its overall quality. Any business can put up a good quarter or two, but the best consistently grow over the long haul.
With $26.84 billion in revenue over the past 12 months, Flex is a behemoth in the business services sector and benefits from economies of scale, giving it an edge in distribution. This also enables it to gain more leverage on its fixed costs than smaller competitors and the flexibility to offer lower prices. However, its scale is a double-edged sword because it’s harder to find incremental growth when you’ve penetrated most of the market. To accelerate sales, Flex likely needs to optimize its pricing or lean into new offerings and international expansion.
As you can see below, Flex’s sales grew at a sluggish 2.8% compounded annual growth rate over the last five years. This shows it failed to generate demand in any major way and is a rough starting point for our analysis.
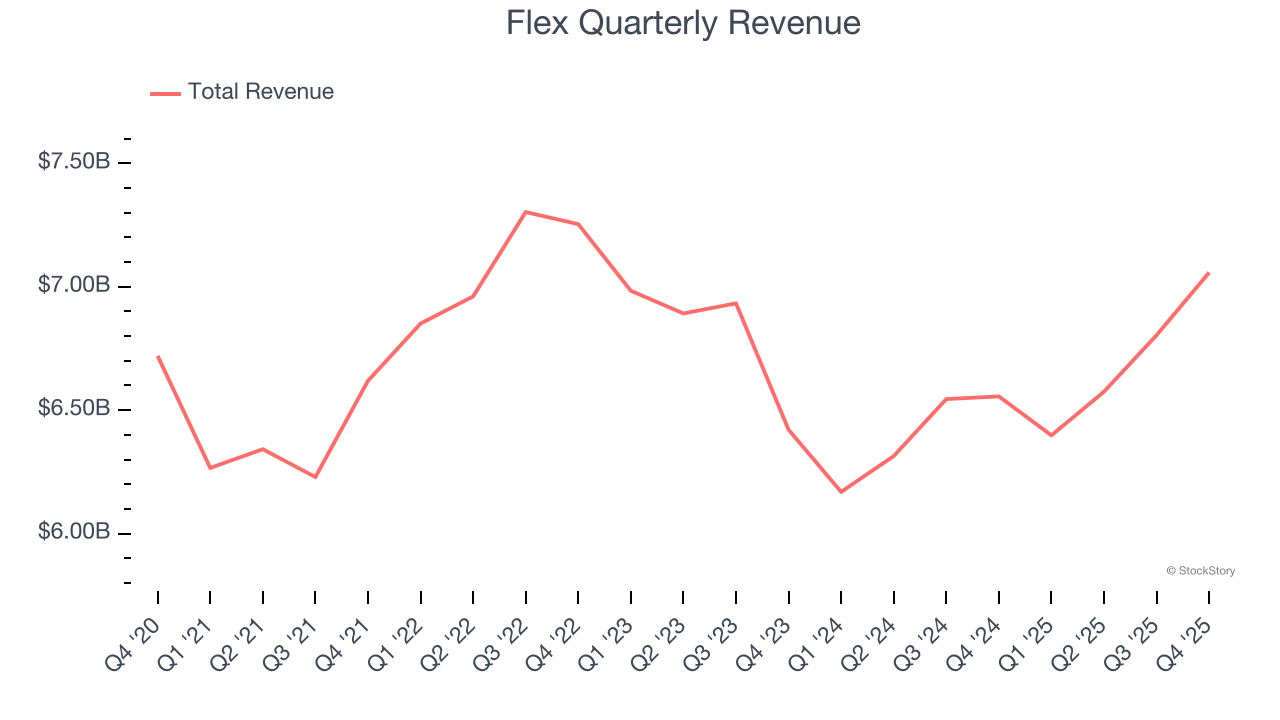
We at StockStory place the most emphasis on long-term growth, but within business services, a half-decade historical view may miss recent innovations or disruptive industry trends. Flex’s recent performance shows its demand has slowed as its revenue was flat over the last two years.
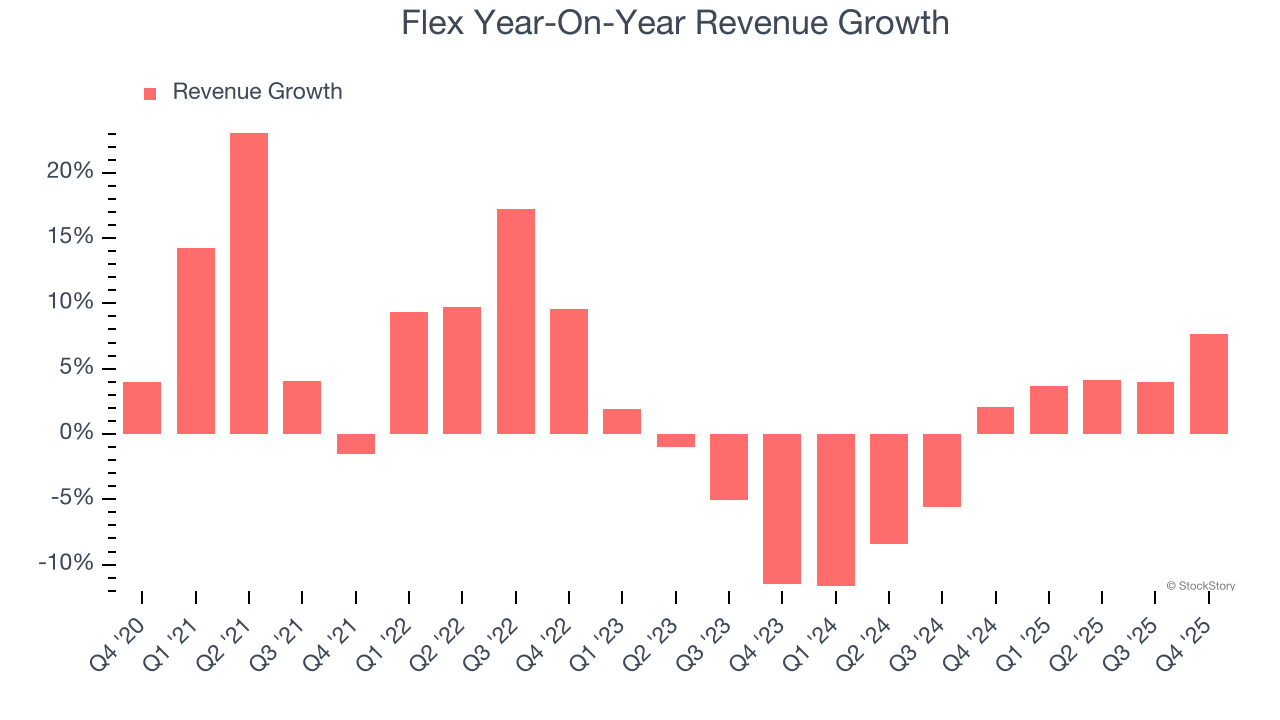
This quarter, Flex reported year-on-year revenue growth of 7.7%, and its $7.06 billion of revenue exceeded Wall Street’s estimates by 3.6%. Company management is currently guiding for a 7.8% year-on-year increase in sales next quarter.
Looking further ahead, sell-side analysts expect revenue to grow 5.6% over the next 12 months, an improvement versus the last two years. This projection is above the sector average and suggests its newer products and services will fuel better top-line performance.
Microsoft, Alphabet, Coca-Cola, Monster Beverage—all began as under-the-radar growth stories riding a massive trend. We’ve identified the next one: a profitable AI semiconductor play Wall Street is still overlooking. Go here for access to our full report.
Flex’s operating margin might fluctuated slightly over the last 12 months but has generally stayed the same, averaging 4% over the last five years. This profitability was lousy for a business services business and caused by its suboptimal cost structure.
Looking at the trend in its profitability, Flex’s operating margin might fluctuated slightly but has generally stayed the same over the last five years. This raises questions about the company’s expense base because its revenue growth should have given it leverage on its fixed costs, resulting in better economies of scale and profitability.
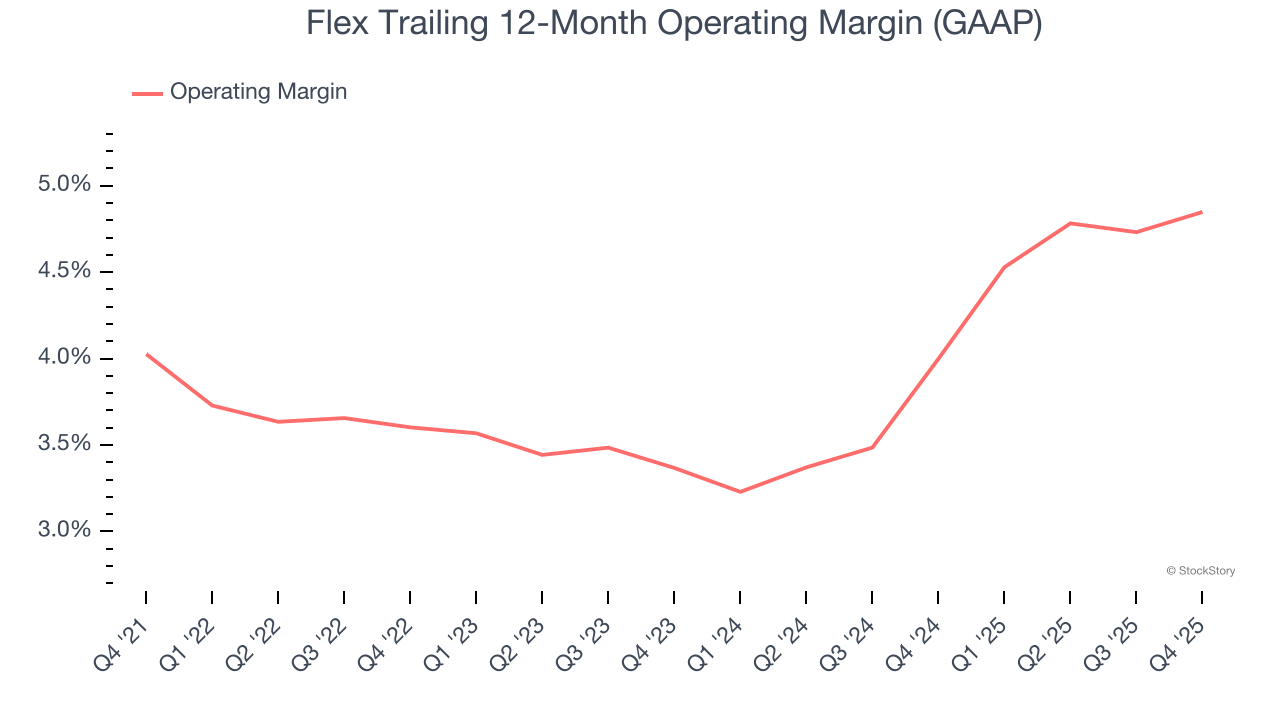
In Q4, Flex generated an operating margin profit margin of 5.5%, in line with the same quarter last year. This indicates the company’s overall cost structure has been relatively stable.
We track the long-term change in earnings per share (EPS) for the same reason as long-term revenue growth. Compared to revenue, however, EPS highlights whether a company’s growth is profitable.
Flex’s EPS grew at an astounding 18% compounded annual growth rate over the last five years, higher than its 2.8% annualized revenue growth. This tells us the company became more profitable on a per-share basis as it expanded.
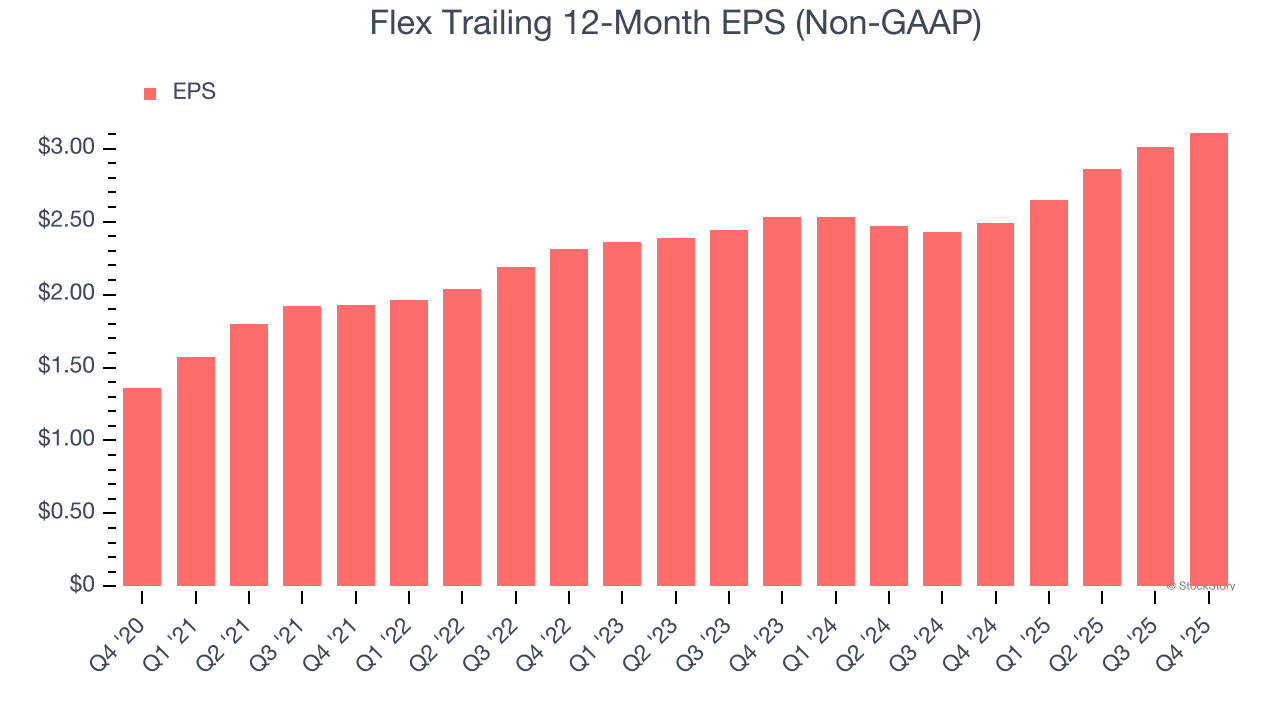
Like with revenue, we analyze EPS over a more recent period because it can provide insight into an emerging theme or development for the business.
For Flex, its two-year annual EPS growth of 10.9% was lower than its five-year trend. We hope its growth can accelerate in the future.
In Q4, Flex reported adjusted EPS of $0.87, up from $0.77 in the same quarter last year. This print easily cleared analysts’ estimates, and shareholders should be content with the results. Over the next 12 months, Wall Street expects Flex’s full-year EPS of $3.11 to grow 10.3%.
We enjoyed seeing Flex beat analysts’ full-year EPS guidance expectations this quarter. We were also glad its revenue outperformed Wall Street’s estimates. Overall, we think this was a solid quarter with some key areas of upside. The stock traded up 1.4% to $66.89 immediately after reporting.
Indeed, Flex had a rock-solid quarterly earnings result, but is this stock a good investment here? The latest quarter does matter, but not nearly as much as longer-term fundamentals and valuation, when deciding if the stock is a buy. We cover that in our actionable full research report which you can read here (it’s free).
| Jul-09 | |
| Jul-08 | |
| Jun-30 | |
| Jun-25 | |
| Jun-09 | |
| Jun-09 | |
| Jun-08 | |
| Jun-08 | |
| Jun-08 | |
| Jun-08 | |
| Jun-08 | |
| Jun-05 | |
| Jun-05 | |
| Jun-01 | |
| May-28 |
Join thousands of traders who make more informed decisions with our premium features. Real-time quotes, advanced visualizations, alerts, and much more.
Learn more about Finviz Elite