|
|
|

|
|||||
|
|
|
Healthcare distributor and services company McKesson (NYSE:MCK) met Wall Street’s revenue expectations in Q4 CY2025, with sales up 11.4% year on year to $106.2 billion. Its non-GAAP profit of $9.34 per share was 0.7% above analysts’ consensus estimates.
Is now the time to buy McKesson? Find out by accessing our full research report, it’s free.
With roots dating back to 1833, making it one of America's oldest continuously operating businesses, McKesson (NYSE:MCK) is a healthcare services company that distributes pharmaceuticals, medical supplies, and provides technology solutions to pharmacies, hospitals, and healthcare providers.
A company’s long-term performance is an indicator of its overall quality. Any business can put up a good quarter or two, but the best consistently grow over the long haul. Luckily, McKesson’s sales grew at a decent 10.9% compounded annual growth rate over the last five years. Its growth was slightly above the average healthcare company and shows its offerings resonate with customers.
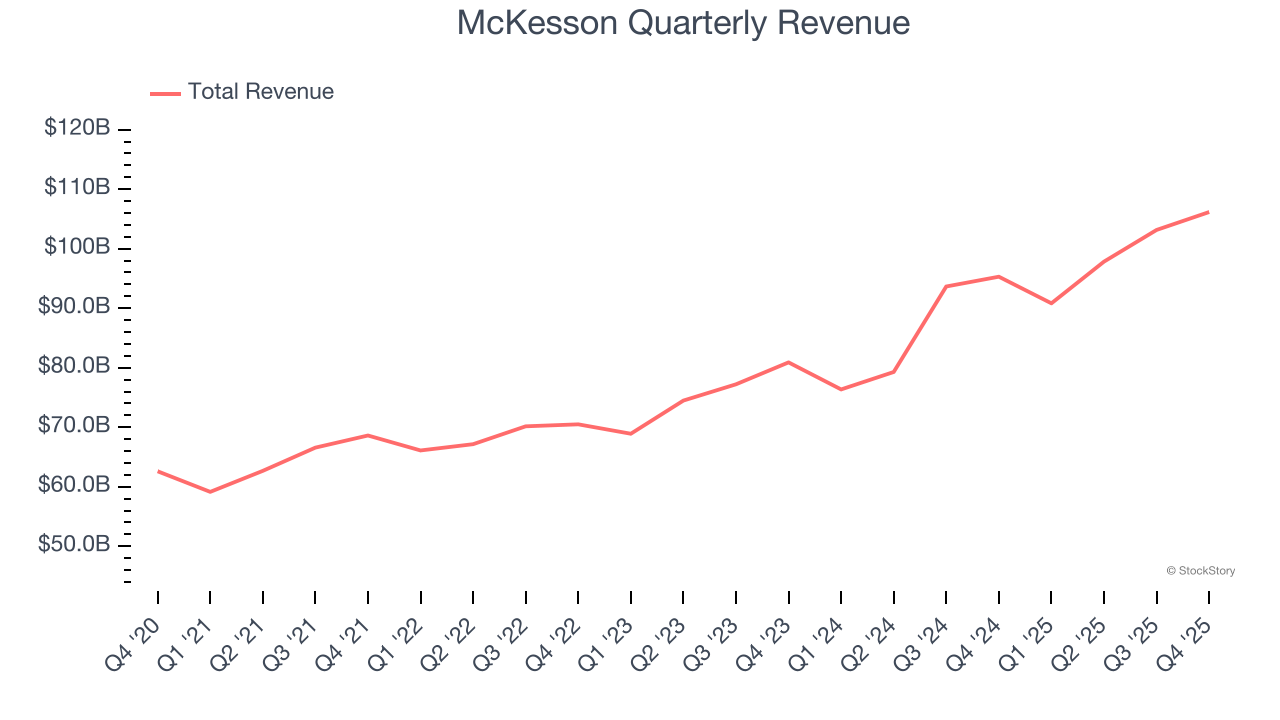
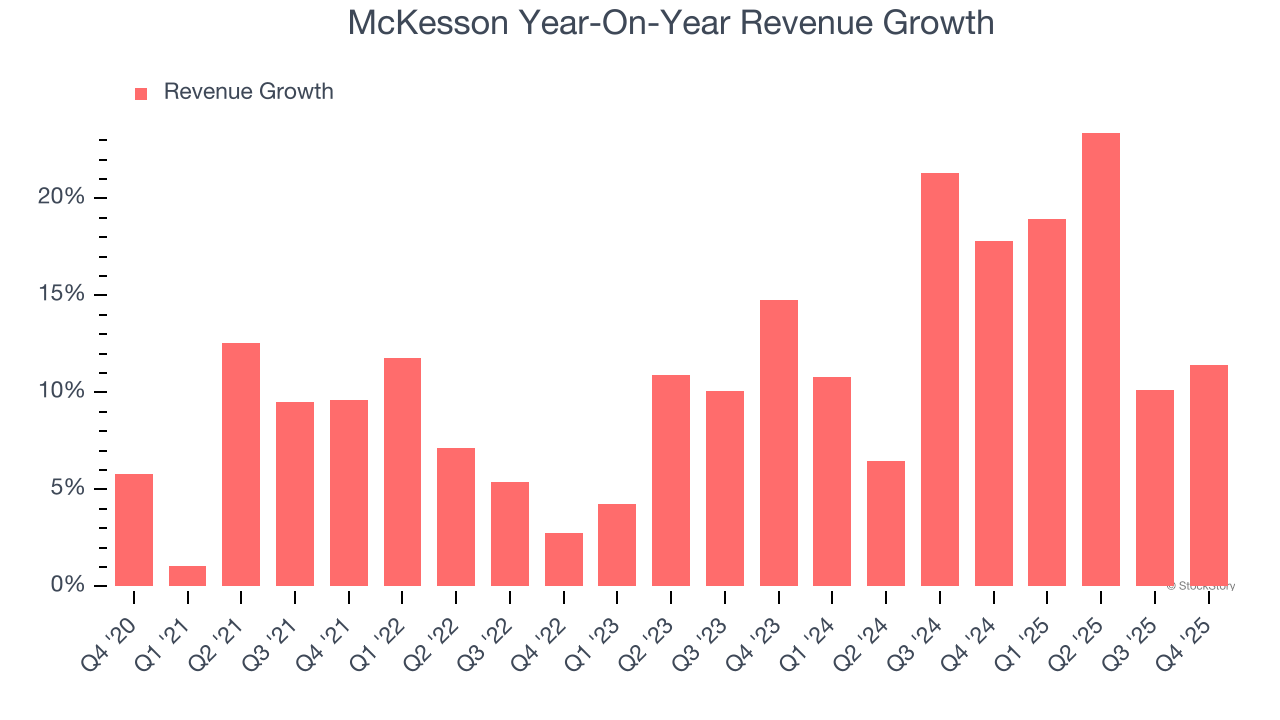
We at StockStory place the most emphasis on long-term growth, but within healthcare, a half-decade historical view may miss recent innovations or disruptive industry trends. McKesson’s annualized revenue growth of 14.9% over the last two years is above its five-year trend, suggesting its demand recently accelerated.
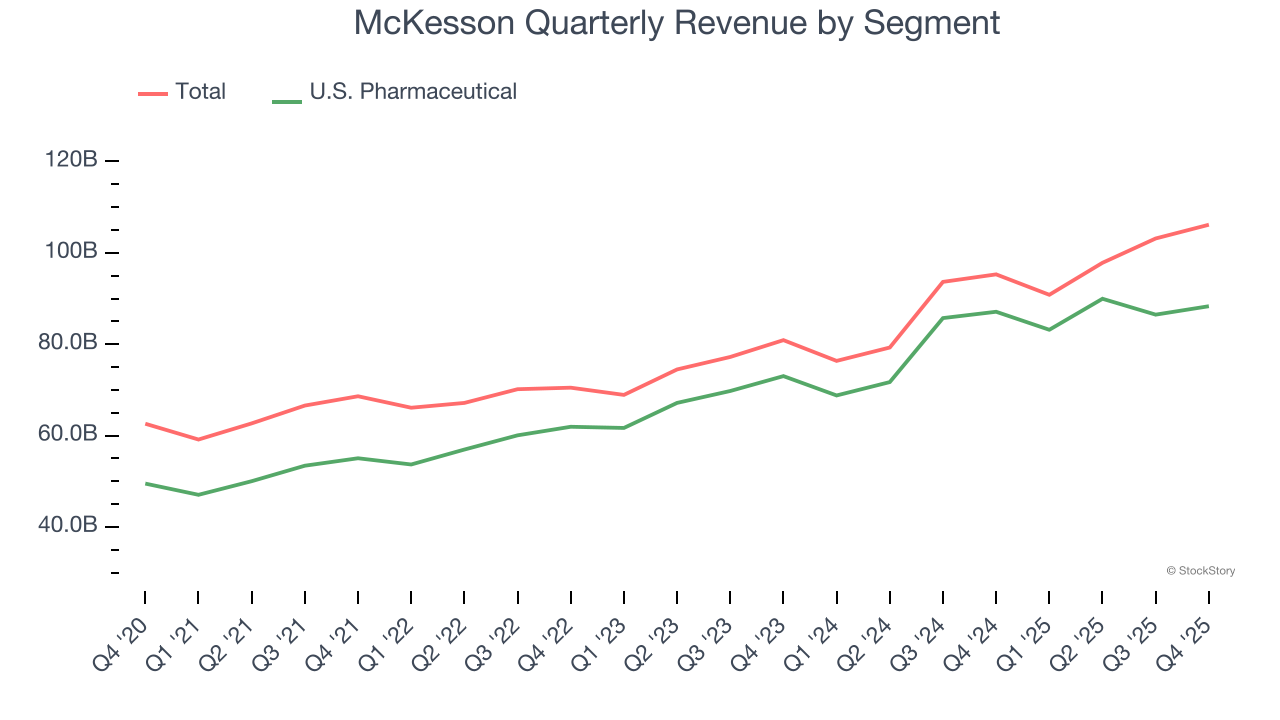
We can dig further into the company’s revenue dynamics by analyzing its most important segment, U.S. Pharmaceutical . Over the last two years, McKesson’s U.S. Pharmaceutical revenue averaged 13.6% year-on-year growth.
This quarter, McKesson’s year-on-year revenue growth was 11.4%, and its $106.2 billion of revenue was in line with Wall Street’s estimates.
Looking ahead, sell-side analysts expect revenue to grow 9.8% over the next 12 months, a deceleration versus the last two years. We still think its growth trajectory is attractive given its scale and suggests the market is baking in success for its products and services.
While Wall Street chases Nvidia at all-time highs, an under-the-radar semiconductor supplier is dominating a critical AI component these giants can’t build without. Click here to access our free report one of our favorites growth stories.
Operating margin is one of the best measures of profitability because it tells us how much money a company takes home after subtracting all core expenses, like marketing and R&D.
McKesson’s operating margin might fluctuated slightly over the last 12 months but has remained more or less the same, averaging 1.3% over the last five years. This profitability was lousy for a healthcare business and caused by its suboptimal cost structure.
Looking at the trend in its profitability, McKesson’s operating margin might fluctuated slightly but has generally stayed the same over the last five years. This raises questions about the company’s expense base because its revenue growth should have given it leverage on its fixed costs, resulting in better economies of scale and profitability.
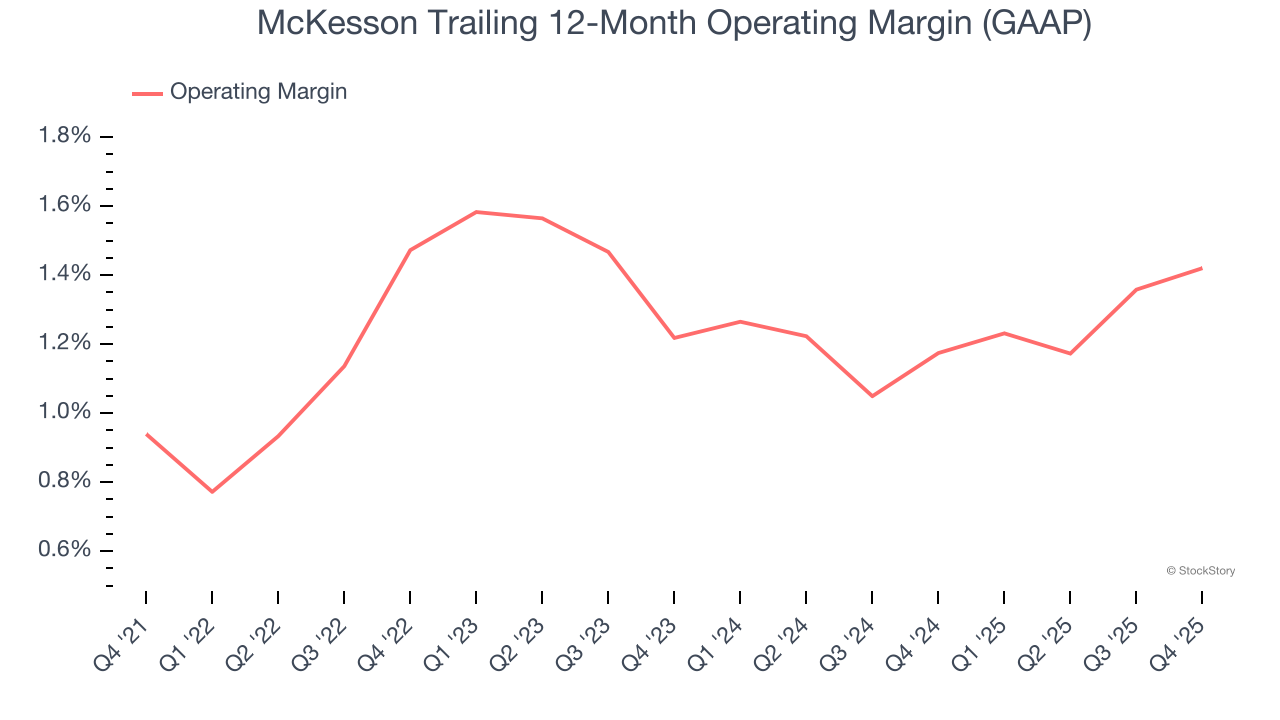
In Q4, McKesson generated an operating margin profit margin of 1.5%, in line with the same quarter last year. This indicates the company’s overall cost structure has been relatively stable.
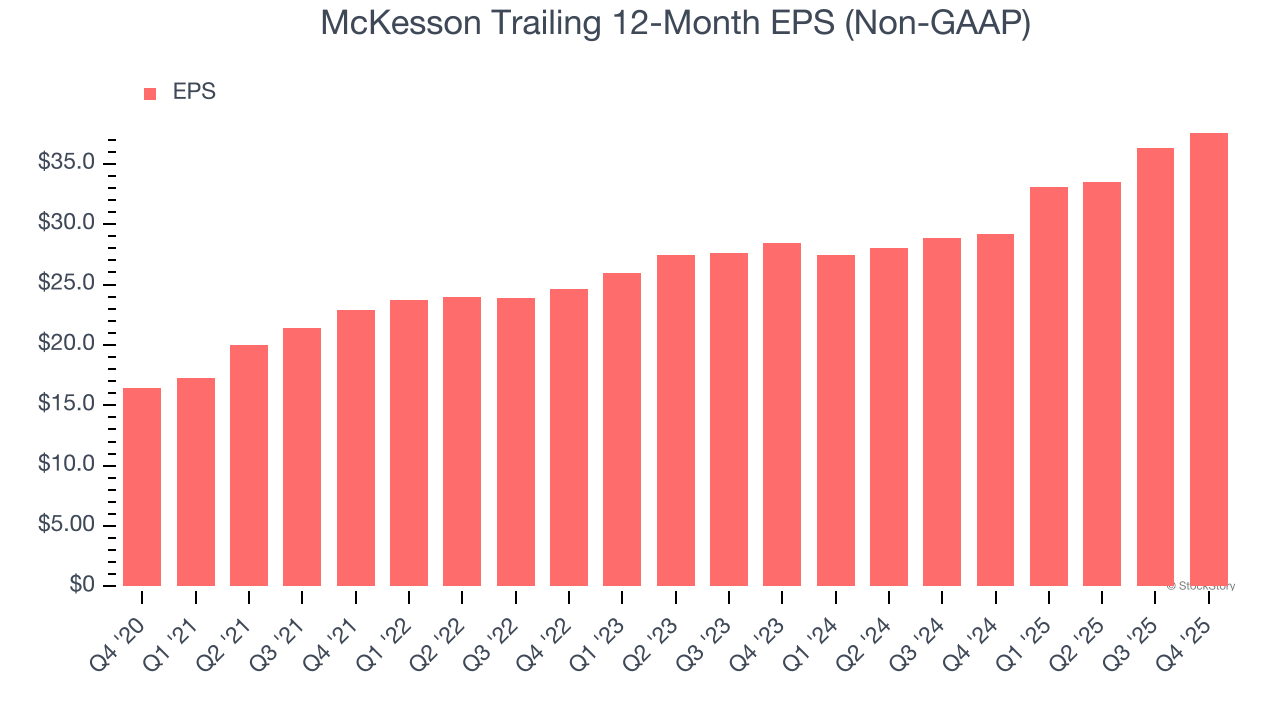
Revenue trends explain a company’s historical growth, but the long-term change in earnings per share (EPS) points to the profitability of that growth – for example, a company could inflate its sales through excessive spending on advertising and promotions.
McKesson’s EPS grew at an astounding 18% compounded annual growth rate over the last five years, higher than its 10.9% annualized revenue growth. This tells us the company became more profitable on a per-share basis as it expanded.
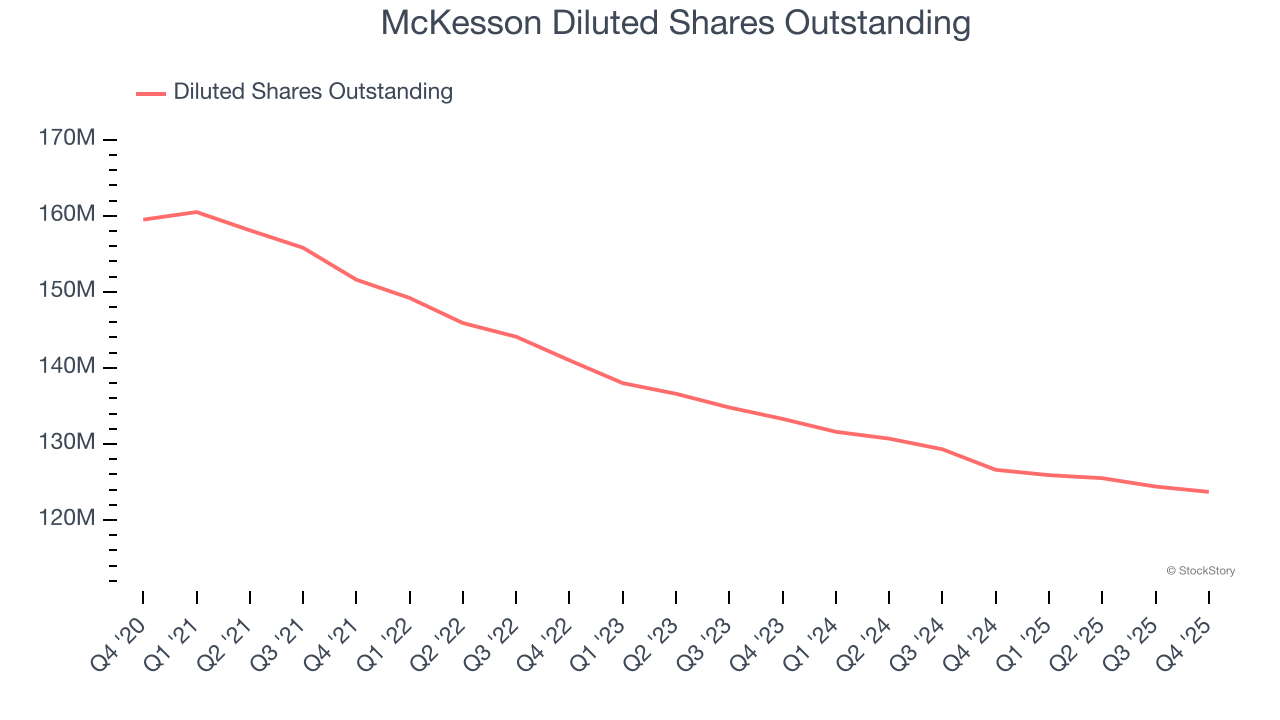
We can take a deeper look into McKesson’s earnings to better understand the drivers of its performance. A five-year view shows that McKesson has repurchased its stock, shrinking its share count by 22.4%. This tells us its EPS outperformed its revenue not because of increased operational efficiency but financial engineering, as buybacks boost per share earnings.
In Q4, McKesson reported adjusted EPS of $9.34, up from $8.03 in the same quarter last year. This print was close to analysts’ estimates. Over the next 12 months, Wall Street expects McKesson’s full-year EPS of $37.58 to grow 14.2%.
It was good to see McKesson narrowly top analysts’ full-year EPS guidance expectations this quarter. Zooming out, we think this was a decent quarter. The stock traded up 2.1% to $839 immediately following the results.
Is McKesson an attractive investment opportunity right now? What happened in the latest quarter matters, but not as much as longer-term business quality and valuation, when deciding whether to invest in this stock. We cover that in our actionable full research report which you can read here (it’s free).
| Jul-22 | |
| Jul-09 | |
| Jul-08 | |
| Jun-30 | |
| Jun-24 | |
| Jun-03 | |
| Jun-03 | |
| Jun-02 | |
| May-07 | |
| May-07 | |
| May-04 | |
| Apr-30 | |
| Apr-28 | |
| Apr-22 | |
| Apr-20 |
Join thousands of traders who make more informed decisions with our premium features. Real-time quotes, advanced visualizations, alerts, and much more.
Learn more about Finviz Elite