|
|
|

|
|||||
|
|
|

Athletic apparel company Under Armour (NYSE:UAA) announced better-than-expected revenue in Q4 CY2025, but sales fell by 5.2% year on year to $1.33 billion. Its non-GAAP profit of $0.09 per share was significantly above analysts’ consensus estimates.
Is now the time to buy Under Armour? Find out by accessing our full research report, it’s free.
"Our third quarter adjusted operating results exceeded expectations, and despite a few unfortunate, non-recurring impacts, we're encouraged by the progress we're making in the business to reignite brand momentum," said Under Armour President and CEO Kevin Plank.
Founded in 1996 by a former University of Maryland football player, Under Armour (NYSE:UAA) is an apparel brand specializing in sportswear designed to improve athletic performance.
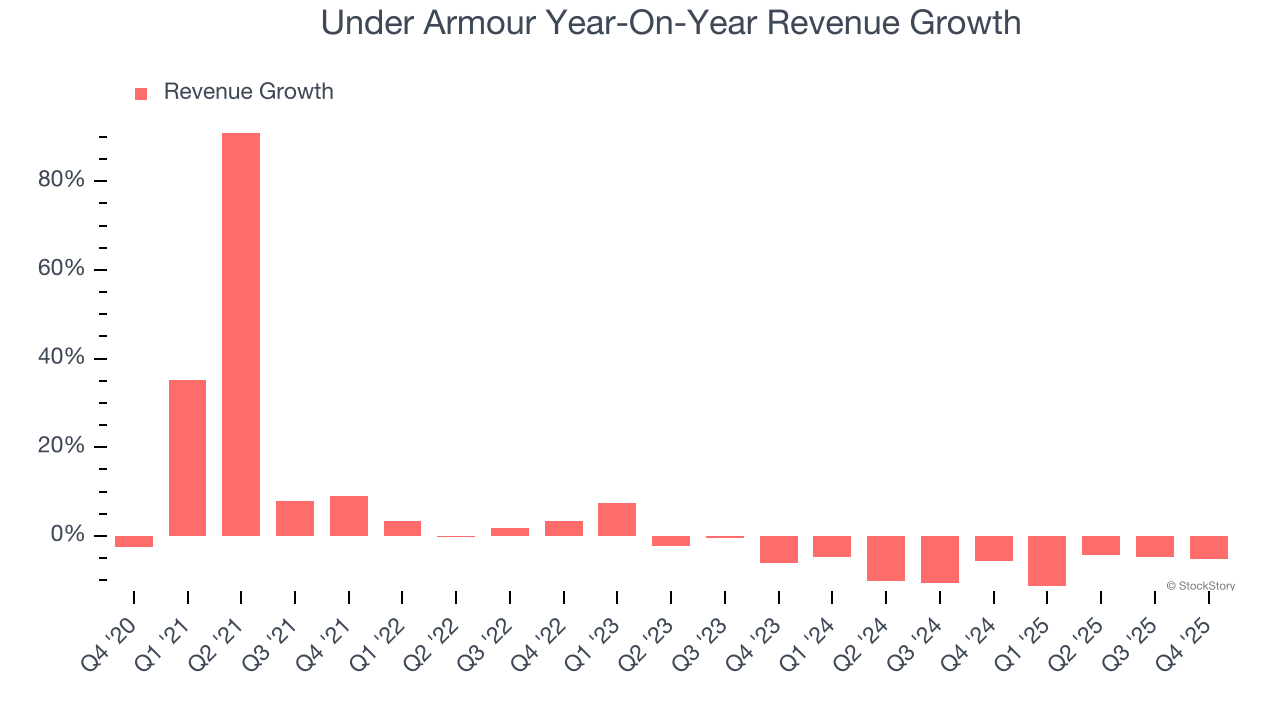
A company’s long-term sales performance can indicate its overall quality. Any business can put up a good quarter or two, but many enduring ones grow for years. Regrettably, Under Armour’s sales grew at a weak 2.1% compounded annual growth rate over the last five years. This was below our standards and is a poor baseline for our analysis.
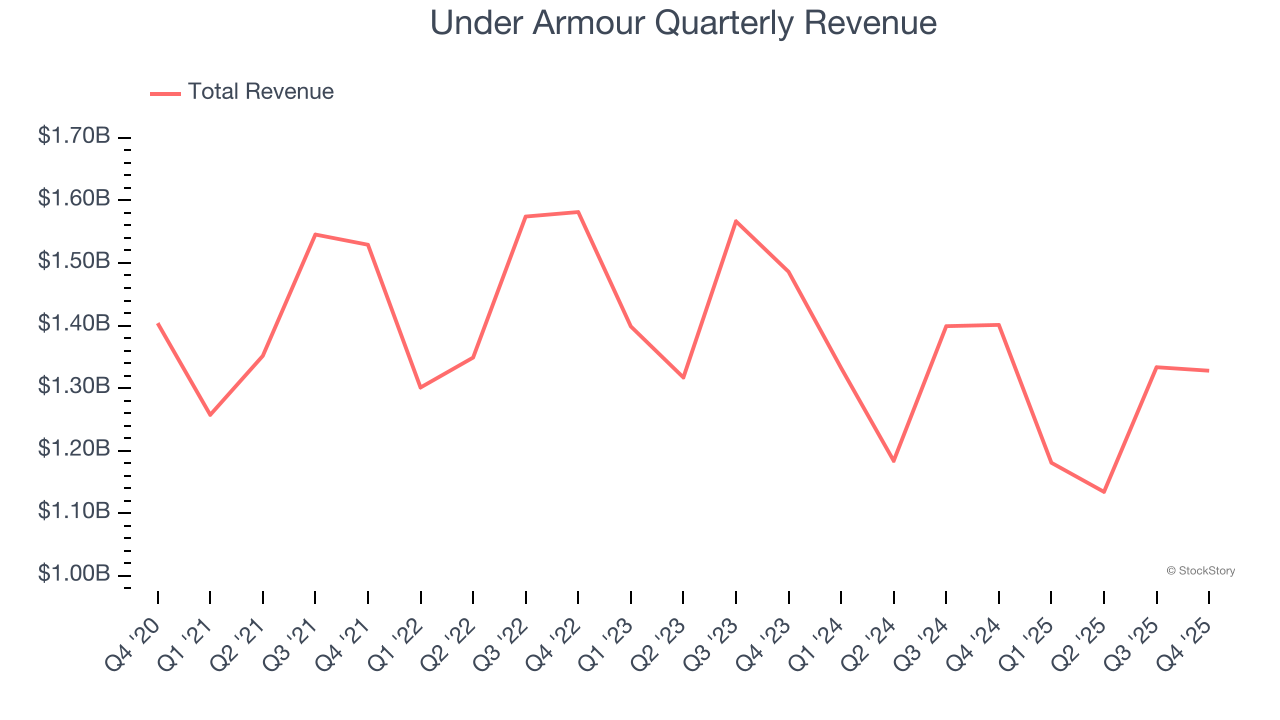
We at StockStory place the most emphasis on long-term growth, but within consumer discretionary, a stretched historical view may miss a company riding a successful new product or trend. Under Armour’s performance shows it grew in the past but relinquished its gains over the last two years, as its revenue fell by 7.1% annually.
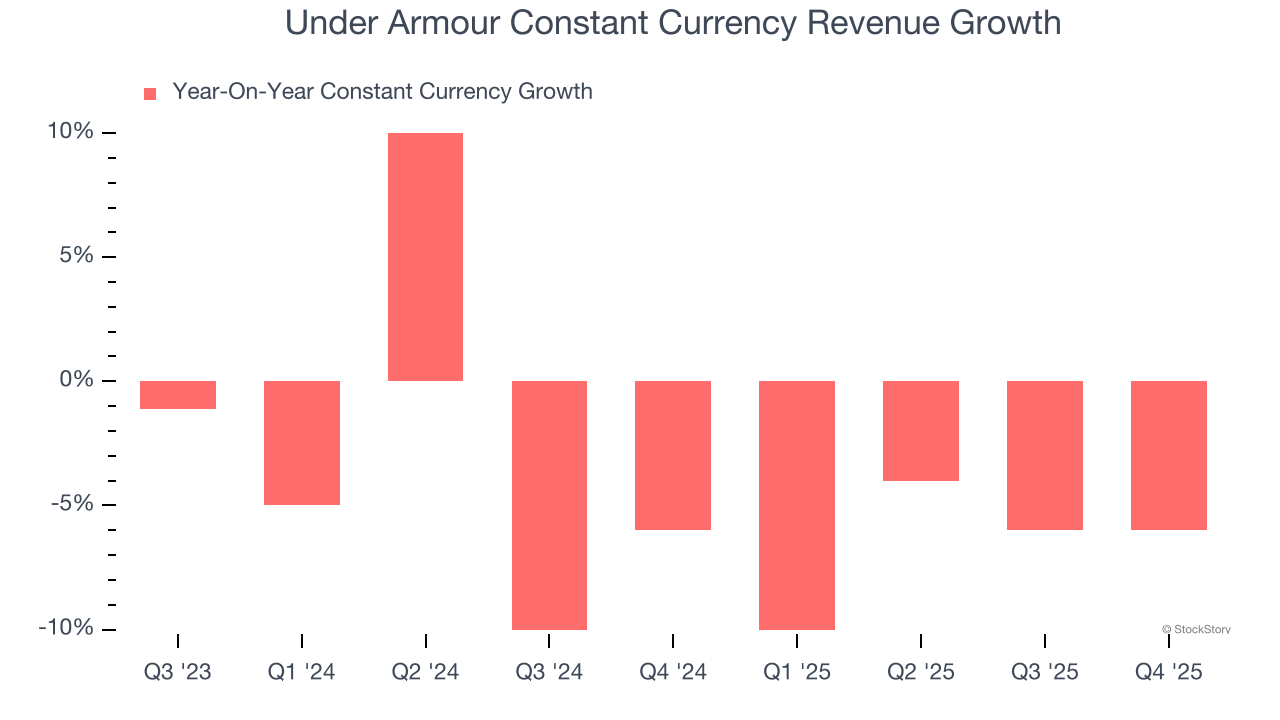
We can dig further into the company’s sales dynamics by analyzing its constant currency revenue, which excludes currency movements that are outside their control and not indicative of demand. Over the last two years, its constant currency sales averaged 4.6% year-on-year declines. Because this number is better than its normal revenue growth, we can see that foreign exchange rates have been a headwind for Under Armour.
This quarter, Under Armour’s revenue fell by 5.2% year on year to $1.33 billion but beat Wall Street’s estimates by 1.2%.
Looking ahead, sell-side analysts expect revenue to remain flat over the next 12 months. Although this projection implies its newer products and services will spur better top-line performance, it is still below average for the sector.
The 1999 book Gorilla Game predicted Microsoft and Apple would dominate tech before it happened. Its thesis? Identify the platform winners early. Today, enterprise software companies embedding generative AI are becoming the new gorillas. a profitable, fast-growing enterprise software stock that is already riding the automation wave and looking to catch the generative AI next.
Under Armour’s operating margin has shrunk over the last 12 months and averaged negative 3.1% over the last two years. Unprofitable consumer discretionary companies with falling margins deserve extra scrutiny because they’re spending loads of money to stay relevant, an unsustainable practice.
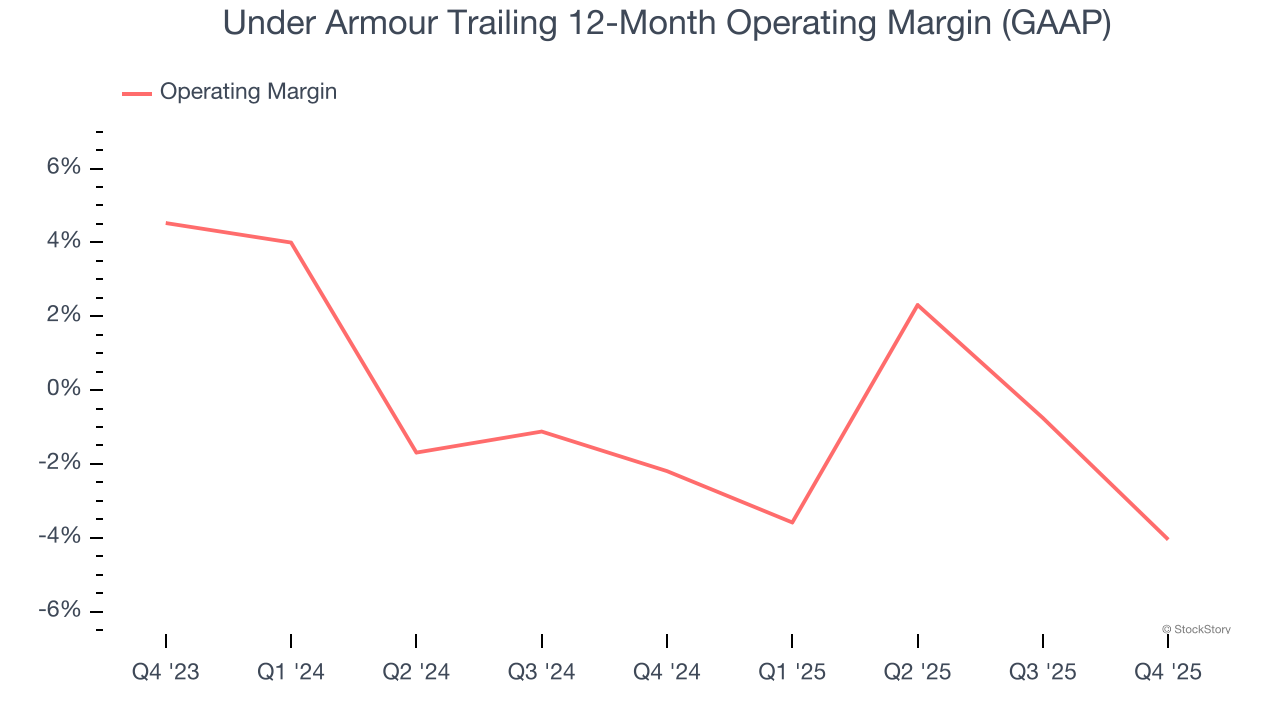
In Q4, Under Armour generated a negative 11.3% operating margin. The company's consistent lack of profits raise a flag.
We track the long-term change in earnings per share (EPS) for the same reason as long-term revenue growth. Compared to revenue, however, EPS highlights whether a company’s growth is profitable.
Under Armour’s full-year EPS flipped from negative to positive over the last five years. This is encouraging and shows it’s at a critical moment in its life.
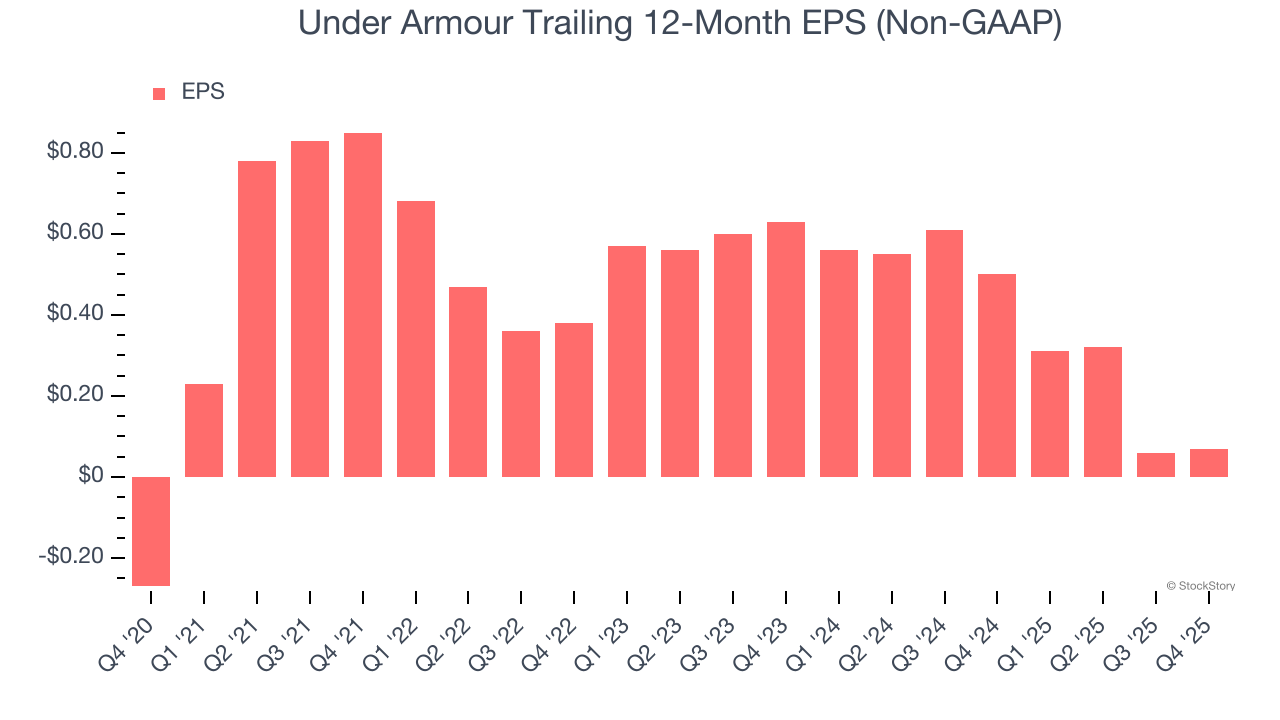
In Q4, Under Armour reported adjusted EPS of $0.09, up from $0.08 in the same quarter last year. This print easily cleared analysts’ estimates, and shareholders should be content with the results. Over the next 12 months, Wall Street expects Under Armour’s full-year EPS of $0.07 to grow 161%.
It was good to see Under Armour beat analysts’ EPS expectations this quarter. We were also glad its full-year EPS guidance trumped Wall Street’s estimates. On the other hand, its EBITDA missed. Overall, we think this was a decent quarter with some key metrics above expectations. The stock traded up 4% to $6.56 immediately following the results.
Sure, Under Armour had a solid quarter, but if we look at the bigger picture, is this stock a buy? If you’re making that decision, you should consider the bigger picture of valuation, business qualities, as well as the latest earnings. We cover that in our actionable full research report which you can read here (it’s free).
| Jul-01 | |
| Jul-01 | |
| Jun-30 | |
| Jun-26 | |
| Jun-22 | |
| Jun-18 | |
| Jun-16 | |
| Jun-12 | |
| Jun-05 | |
| Jun-02 | |
| May-29 | |
| May-29 | |
| May-22 | |
| May-21 | |
| May-20 |
Join thousands of traders who make more informed decisions with our premium features. Real-time quotes, advanced visualizations, alerts, and much more.
Learn more about Finviz Elite