|
|
|

|
|||||
|
|
|
Retail REIT investors looking for stability often narrow their search to two proven operators: Realty Income O and Regency Centers REG. Both focus on necessity-based retail and maintain investment-grade balance sheets, but beneath the surface, their growth engines are very different.
Realty Income relies on long-duration net leases and large-scale capital deployment to drive steady expansion. Regency Centers, with a focus on open-air properties, is leaning into leasing spreads, occupancy gains and a deep development pipeline in grocery-anchored suburban centers. The distinction matters. One model prioritizes predictability and scale. The other is generating stronger internal growth and higher incremental returns on capital.
For investors trying to decide between the two, the question is which one is better positioned going forward. Let’s break down the case for each.
Realty Income’s defining strength is its unmatched scale and diversification. As of the third quarter of 2025, the REIT owned more than 15,500 properties spanning the United States and Europe, with portfolio occupancy at an impressive 98.7%. Its weighted average remaining lease term of roughly nine years provides exceptional cash flow visibility. No single tenant contributes more than about 3% of annualized base rent, significantly mitigating concentration risk. Relative to grocery-anchored peers that depend heavily on a limited group of retail categories, Realty Income’s broad tenant and sector mix helps dampen earnings volatility across cycles.
Operational performance has remained resilient. In the third quarter of 2025, revenues climbed about 10% year over year to nearly $1.47 billion, while adjusted funds from operations (AFFO) per share reached $1.08. The company deployed approximately $1.4 billion during the quarter at an attractive initial weighted average cash yield of 7.7%. For full-year 2026, investment guidance is for more than $6.0 billion, underscoring its capacity to source and execute large-scale transactions efficiently.
Strategic optionality further enhances the platform. A sizable partnership with GIC to pursue build-to-suit and industrial investments, along with an $800 million preferred equity commitment tied to CityCenter real estate, broadens its opportunity set beyond traditional retail net leases and reflects strong institutional relationships.
Dividend reliability remains the cornerstone. Known as “The Monthly Dividend Company,” Realty Income has declared 668 consecutive monthly dividends, including 133 increases in 2025 alone. With an annualized payout of $3.24 per share, its steady income stream is underpinned by long lease durations, high-quality tenants and disciplined balance sheet management.
However, Realty Income’s steady model comes with trade-offs. Same-store revenue growth tends to be gradual, and long-term net lease contracts limit upside during periods of strong economic expansion. Its highly diversified portfolio can temper participation in faster-growing segments, modestly constraining short-term growth prospects.
Regency Centers ended 2025 with one of its strongest operational years. Same-property NOI growth reached 4.7% for the fourth quarter and 5.3% for the full year, supported by higher occupancy and strong rent spreads. Fourth-quarter cash rent spreads hit 12%, with renewal spreads at a record 13%. GAAP spreads were even higher. This kind of leasing power reflects real demand for Regency’s grocery-anchored centers.
Occupancy trends are equally impressive. Same-property portfolio occupancy reached 96.5% leased at year-end. Management noted strong tenant demand across both anchor and shop space. Leasing activity included major grocers such as Whole Foods, Sprouts and Trader Joe’s. Healthy tenant sales, rising foot traffic and historically low bad debt further support the operating backdrop.
Development is a key differentiator. In 2025, Regency deployed more than $825 million into investments, including more than $300 million in development and redevelopment projects. According to management, ground-up development returns are north of 7% at meaningful spreads to market cap rates. The in-process pipeline stands near $600 million, with strong visibility to additional starts over the next three years. In a sector where new supply has been limited for years, Regency’s ability to build new grocery-anchored centers is a competitive edge.
Financially, Regency maintains A3 and A- credit ratings from Moody’s and S&P, leverage within its 5X to 5.5X target range and nearly full availability on its $1.5 billion credit facility. Management emphasized strong free cash flow, with no need to raise equity to fund its development pipeline. That balance sheet strength supports continued growth.
The main risk is concentration. Regency is focused on grocery-anchored suburban retail. While that segment has been resilient, it is still retail. Consumer spending slowdowns, tenant disruptions or unexpected store closures could create near-term volatility. That said, management highlighted the essential nature of its tenant base and the resilience of its markets.
The Zacks Consensus Estimate for Realty Income’s 2025 and 2026 sales implies year-over-year growth of 8.54% and 7.15%, respectively. The consensus mark for 2025 and 2026 funds from operations (FFO) per share suggests year-over-year growth of only 1.91% and 3.83%, respectively. Over the past month, estimates for O’s 2025 and 2026 FFO per share have been tweaked northward by a tad to $4.27 and $4.43, respectively.
For Realty Income:

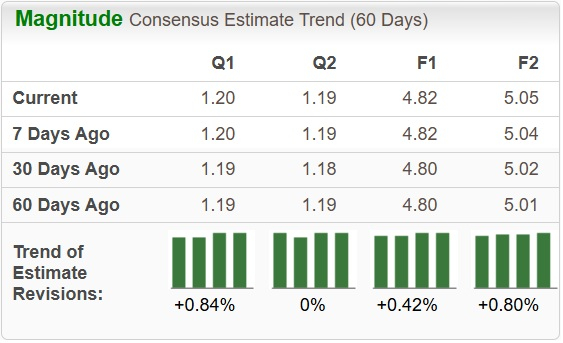
The Zacks Consensus Estimate for Regency’s 2026 sales calls for year-over-year growth of 3.41%. The consensus mark for 2025 FFO per share has been revised 2 cents upward over the past month to $4.82. The figure suggests a year-over-year increase of 3.88%.
For Regency:
Over the past three months, Realty Income shares have risen 15.6%, while Regency stock has gained 9.1%. In comparison, the Zacks REIT and Equity Trust - Retail industry has rallied 14.6%, while the S&P 500 composite has risen 5.3% in the same time frame.

O is trading at a forward 12-month price-to-FFO, which is a commonly used multiple for valuing REITs, of 14.63X, which is above its three-year median.
REG is presently trading at a forward 12-month price-to-FFO of 15.61X, which is also above its three-year median of 15.08X. Both O and REG carry a Value Score of D.

Both companies offer quality retail exposure backed by strong balance sheets. Realty Income provides diversification, long lease duration and unmatched investment scale. Its model delivers stability and predictable cash flow.
Regency Centers, however, is generating faster internal growth. Double-digit leasing spreads, record occupancy, 7%+ development yields and solid FFO growth reflect a portfolio benefiting from limited retail supply and strong tenant demand. For investors focused on durable, internally driven earnings momentum rather than scale alone, Regency Centers stands out as the better REIT pick currently.
While REG carries a Zacks Rank #2 (Buy), O has a Zacks Rank #3 (Hold). You can see the complete list of today’s Zacks #1 Rank (Strong Buy) stocks here.
Note: Anything related to earnings presented in this write-up represent funds from operations (FFO) — a widely used metric to gauge the performance of REITs.
Want the latest recommendations from Zacks Investment Research? Today, you can download 7 Best Stocks for the Next 30 Days. Click to get this free report
This article originally published on Zacks Investment Research (zacks.com).
| 8 hours | |
| Jul-13 | |
| Jul-13 | |
| Jul-13 | |
| Jul-07 | |
| Jul-02 | |
| Jul-01 | |
| Jul-01 | |
| Jun-30 | |
| Jun-29 | |
| Jun-25 | |
| Jun-25 | |
| Jun-09 | |
| May-28 | |
| May-28 |
Join thousands of traders who make more informed decisions with our premium features. Real-time quotes, advanced visualizations, alerts, and much more.
Learn more about Finviz Elite