|
|
|

|
|||||
|
|
|
Gildan Activewear Inc. GIL reported fourth-quarter 2025 results, wherein both the top and bottom lines missed the Zacks Consensus Estimate. However, both metrics showed year-over-year growth.
GIL delivered quarterly earnings per share (EPS) of 96 cents, lagging the Zacks Consensus Estimate of $1.31 per share. The quarterly EPS increased 15.7% year over year compared with earnings of 83 cents per share a year ago.

Gildan Activewear, Inc. price-consensus-eps-surprise-chart | Gildan Activewear, Inc. Quote
Net sales came in at $1,078.5 million, up 31.3% year over year from $821.5 million but missed the Zacks Consensus Estimate of $1,125 million. Excluding Hanes’ $217 million contribution from Dec. 1 to 28, 2025, the organic sales growth was 4.9% for the period, highlighting continued strength in the core business.
GIL’s adjusted gross profit increased 37.3% to $347.4 million from $253 million in the prior year. The adjusted gross margin improved by 140 basis points to 32.2% from 30.8%. Margin expansion was primarily supported by strategic pricing, reduced manufacturing and raw material costs, and to a lesser extent, contributions from HanesBrands acquisition.
Adjusted SG&A expenses were $124.5 million compared with $77.9 million in the same period last year, up 59.8% year over year. The increase was due to the combination with HanesBrands, along with purchase accounting impacts, including the amortization of intangible assets with respect to the acquisition.
GIL’s adjusted operating income was $222.9 million compared with $175.1 million, an increase of 27.3% year over year. Operating margin was 20.7%, which declined 60 basis points compared with 21.3% in the prior year. The decline in operating margin primarily reflects HanesBrands’ reduced adjusted operating margin.
The adjusted EBITDA for the company rose 27.4% year over year to $265.4 million from $208.4 million in the previous year.
Sales in the Activewear category rose 10.3% year over year to $787.8 million from $714.1 million, driven by HanesBrands’ contribution, favorable product mix and higher net selling prices. Strong demand from North American distributors was complemented by growth with national account customers, supported by new programs, market share gains and competitive positioning. Solid demand continued for Comfort Colors, while the company’s innovation pipeline, including new soft cotton technology and brands like Champion and ALLPRO, appears encouraging.
In the Innerwear category, including hosiery, underwear, and intimates, net sales surged 170.7% year over year to $290.6 million from $107.4 million, primarily driven by HanesBrands contribution, partly offset by slightly reduced volumes on broader market weakness.
Gildan Activewear’s geographic performance showed strong growth across all regions. In the United States, net sales increased 33.7% year over year to $976.6 million from $730.6 million. Sales in Canada saw a rise of 29% year over year to $34.2 million from $26.5 million in the previous-year period.
International sales rose 5.1% year over year to $67.7 million from $64.4 million, aided by gains from the acquisition, somewhat offset by soft demand across markets, particularly in the U.K.
Operating cash flow, including discontinued operations, rose 20.9% year over year to $606 million from $501 million in the prior-year period, driven mainly by lower working capital investment. Following $114 million in capital expenditures, free cash flow totaled approximately $493 million.
In 2025, the company returned $319 million for the full year through dividends and share repurchase of about 3.8 million under its NCIB program. The company also approved 10% increase in dividends for 2026.
Gildan Activewear ended 2025 with net debt of $4.42 billion and a leverage ratio of 3x net debt to trailing 12 months pro forma adjusted EBITDA.
Looking ahead, for 2026, excluding the HanesBrands Australian business (HAA) and reflecting continuing operations only, the company expects revenues in the range of $6.0 billion to $6.2 billion and a full-year adjusted operating margin of approximately 20%. Capital expenditures are projected to be roughly 3% of net sales. Adjusted diluted EPS is anticipated to be in the range of $4.20 to $4.40, and free cash flow is expected to exceed $850 million.
HAA is expected to contribute approximately $675 million in net sales and 21 cents in EPS, and reflects the expiry of a HanesBrands Transition Service Agreement tied to Champion. It assumes growth from innovation, new programs and incentives, alongside temporary inventory reductions and margin-focused operating adjustments.
Guidance incorporates expected tariff impacts and mitigation actions. For the first quarter of 2026, net sales from continuing operations are expected to be approximately $1.15 billion, reflecting a temporary reduction of inventory across customer channels as manufacturing consolidation progresses. Adjusted operating margin is projected to be about 12.9%, impacted by higher SG&A, including increased amortization and depreciation from HanesBrands purchase accounting, as well as timing differences related to integration costs. The adjusted effective income tax rate is expected to be slightly higher than the full-year 2026 rate.
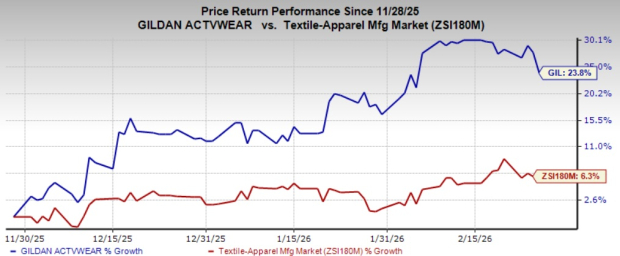
GIL currently carries a Zacks Rank #4 (Sell). The stock has gained 23.8% in the past three months compared with the industry’s rise of 6.3%.
Some better-ranked stocks have been discussed below:
Vince Holding Corp. VNCE provides luxury apparel and accessories in the United States and internationally. It operates through Vince Wholesale and Vince Direct-to-Consumer segments. At present, the company flaunts a Zacks Rank of 1 (Strong Buy). You can see the complete list of today’s Zacks #1 Rank stocks here.
The Zacks Consensus Estimate for VNCE’s current fiscal-year sales and earnings implies growth of 2% and 26.3%, respectively, from the year-ago figures. VNCE has delivered a trailing four-quarter earnings surprise of 229.6%, on average.
Ralph Lauren Corporation RL is a major designer, marketer and distributor of premium lifestyle products in North America, Europe, Asia, and internationally. At present, the company sports a Zacks Rank of 1.
The Zacks Consensus Estimate for Ralph Lauren’s current fiscal-year sales and earnings implies growth of 12.2%, and 31.9% from the year-ago figures. RL has delivered a trailing four-quarter earnings surprise of 9.7%, on average.
Crocs, Inc. CROX is one of the leading footwear brands with its focus on comfort and style. At present, CROX carries a Zacks Rank of 2 (Buy).
The consensus estimate for Crocs’ current fiscal-year sales and earnings implies growth of 0.3% and 5.5%, respectively, from the year-ago figures. CROX has delivered a trailing four-quarter earnings surprise of 16.6 %, on average.
Want the latest recommendations from Zacks Investment Research? Today, you can download 7 Best Stocks for the Next 30 Days. Click to get this free report
This article originally published on Zacks Investment Research (zacks.com).
| Jul-16 | |
| Jul-15 | |
| Jul-15 | |
| Jul-14 | |
| Jul-13 | |
| Jul-13 | |
| Jul-10 | |
| Jul-09 | |
| Jul-09 | |
| Jul-07 | |
| Jul-02 | |
| Jul-01 | |
| Jul-01 | |
| Jun-26 | |
| Jun-26 |
Join thousands of traders who make more informed decisions with our premium features. Real-time quotes, advanced visualizations, alerts, and much more.
Learn more about Finviz Elite