Mining Stock Could Soon Unearth Another Record
Teck Resources Ltd (NYSE:TECK) stock's pullback from its Sept. 8 record high of $72.56 has found support at the 60-, 80-, and 100-day moving averages. The 100-day trendline in particular is a historically bullish signal that presents an intriguing 'buy the dip' angle.
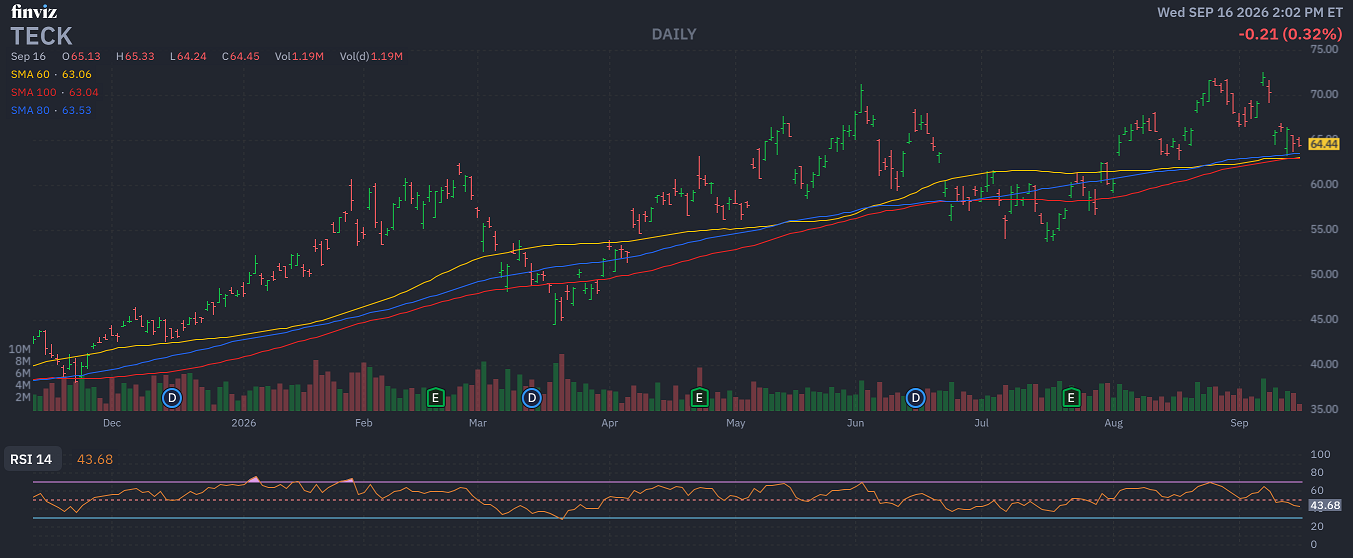
Per Schaeffer's Senior Quantitative Analyst Rocky White, TECK has traded within 0.75 times the 100-day moving average's 20-day average true range (ATR) after spending at least 80% of the previous two weeks and 80% of the prior 42 trading sessions above the trendline. This setup has occurred eight other times over the last decade, after which the stock was higher one month later 75% of the time, averaging a large 13.8% gain.
Short interest accounts for a healthy 7.5% of the stock’s available float, leaving ample sideline buying power should some of these bearish bets begin to unwind. TECK's 14-day Relative Strength Index (RSI) of 28.4 also sits in "oversold" territory, which often precedes a short-term bounce.
Plus, TECK’s Schaeffer’s Volatility Scorecard (SVS) sits at 81 out of 100, suggesting the shares have tended to outperform options traders’ volatility expectations during the past year.
Mentioned In This Article
Latest News
| Nov-05 | |
| Nov-01 | |
| Oct-29 | |
| Oct-29 | |
| Oct-29 | |
| Oct-29 | |
| Oct-26 | |
| Oct-24 | |
| Oct-21 | |
| Oct-21 | |
| Oct-19 | |
| Oct-07 | |
| Oct-06 | |
| Oct-02 | |
| Sep-21 |
