NexPoint Residential's Swap Roll-Off Tests Whether Improving Leasing Can Defend A Reset FFO Target
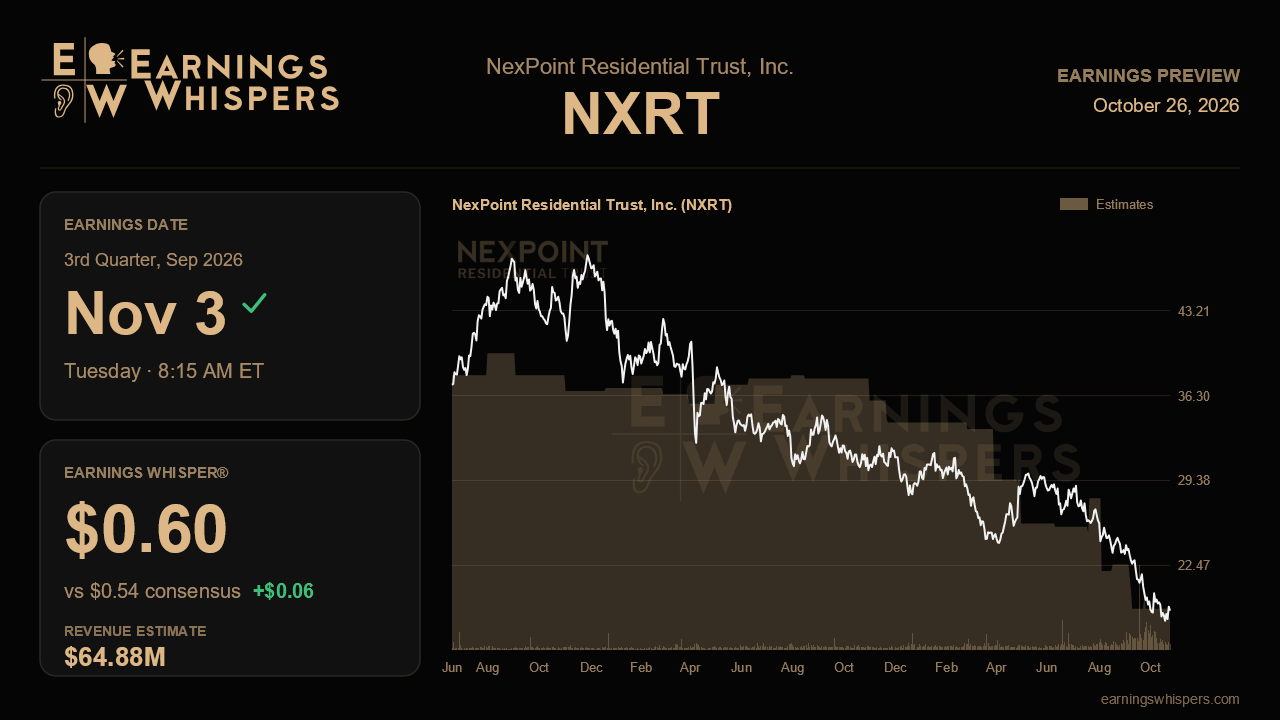
NexPoint Residential Trust heads into its third-quarter report with a stock that has lost more than a quarter of its value since its last update, even as the underlying apartment business showed its first real signs of turning. That disconnect is the story. Management cut its full-year core FFO target last quarter, but mostly because of interest rates, not tenants. This report should show whether the market has priced in a deeper problem or simply overreacted to a mechanical headwind.
The Street is looking for GAAP earnings of $0.54 per share on revenue of about $64.9 million. That revenue figure would be up roughly 3.3% from a year ago and essentially flat with the $64.6 million posted last quarter, which fits a portfolio that is stabilizing rather than accelerating. Earnings are expected to slip from $0.62 last quarter and sit well below the $0.80 of the year-ago period. The Earnings Whisper of $0.60 sits meaningfully above consensus, suggesting some investors believe the bar is set too low. The guidance comparison points the same way. Management now targets roughly $2.45 in 2026 core FFO, yet consensus sits at $2.36, below the company's own outlook. With $1.34 already banked through June, management's figure implies about $1.11 for the back half, while the Street's number implies closer to $1.02. Analysts are effectively betting that the company falls short of a guide it only just lowered.
The biggest swing factor is the expiration of swaps covering about $717.5 million of debt at roughly 1.14% in September. Because that protection ran for most of the quarter, the full cost should land in the fourth quarter, which makes this report less a test of the hit itself than of how cleanly management describes the run rate afterward. Any update on interest expense, which was revised to roughly $71.2 million for the year, and any refinancing or hedging plans will matter more than the quarterly print.
On operations, the prior call laid out a clear trajectory. Blended lease tradeouts climbed from negative 1.7% in April to positive 0.3% in July, the first positive reading since early 2025, while new-lease spreads narrowed sharply. Concession usage was cut roughly in half, with South Florida nearly eliminating them. Validation would mean tradeouts holding or building above zero through the summer leasing season, concessions staying contained, and same-store revenue moving closer to positive territory. A challenge would come if occupancy, which slipped to 93.6% as management protected rents, kept eroding, or if Nashville, responsible for about 85% of the same-store NOI cut, deteriorated further alongside Orlando, Charlotte and Dallas. On costs, management lowered its expense growth outlook to about 2.1% on insurance and tax relief, so any reversal there would undercut one of the cleaner offsets in the story. The roughly $0.05 of interest income from the Waterford bridge loan is another small item worth confirming.
Sentiment has improved noticeably, with bearishness easing from 55% heading into the last report to about 35.5% now, even as the shares fell. At $18.76, the stock trades far below its 200-day average of $26.24 and sits near the bottom of its post-earnings range, a stark drop from last quarter's $25.84 to $30.48 band. That positioning suggests the market already expects little.
The central question is whether NexPoint can show that its leasing recovery is durable enough to absorb the higher interest bill without another cut. Reaffirming $2.45 with positive tradeouts and steady occupancy would argue the selloff went too far. Another reduction, particularly one driven by revenue rather than rates, would suggest the operating inflection is not arriving fast enough to matter.
This earnings preview was originally published on Earnings Whispers.
This article is for informational purposes only and is not investment advice. Earnings Whispers and its staff may hold positions in the securities mentioned. It is AI-assisted, based on proprietary Earnings Whispers data and company reports, and edited by Earnings Whispers staff.
Mentioned In This Article
Latest News
| Oct-26 | |
| Oct-06 | |
| Sep-04 | |
| Aug-04 | |
| Aug-04 | |
| Aug-04 | |
| Jul-28 | |
| Jul-09 | |
| May-28 | |
| Apr-29 | |
| Apr-28 | |
| Apr-28 | |
| Apr-28 | |
| Apr-07 | |
| Mar-11 |
