Trinity Capital Must Show Record Fundings Can Restore Its Thin Dividend Cushion
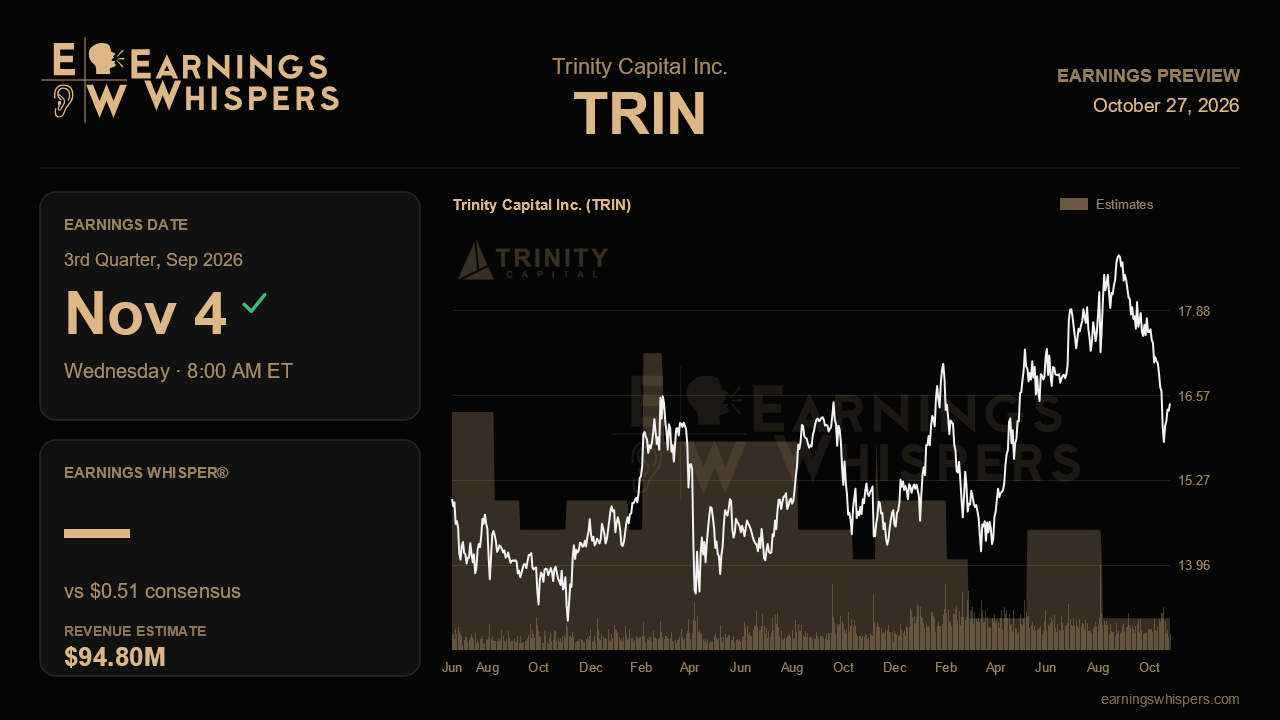
Trinity Capital spent last quarter telling investors that a dip in earnings power was a timing quirk, not a trend. The third-quarter report is where that explanation either holds up or starts to look like an excuse. The venture lender posted record originations, record net asset value and record platform assets in the second quarter. Yet net investment income per share slipped to $0.51, exactly matching the dividend and leaving no coverage cushion. Management argued that back-end-weighted fundings would push income into the third quarter. This is the first report that can prove it.
Wall Street is not yet paying for that recovery. Consensus calls for earnings of $0.51 per share, flat with the prior quarter and about 1.9% below the $0.52 earned a year ago. Revenue is expected to climb to $94.8 million, up 25.5% from $75.6 million and a solid step up from $87.2 million last quarter. That gap between strong top-line growth and flat per-share earnings is the story in miniature. Trinity is growing quickly, but much of that growth has been funded with new equity. Net asset value rose 37% from a year earlier, while NAV per share edged up only modestly to $13.47. Revenue gains are therefore being spread across a larger share base. Management did not issue formal numeric guidance, but it reaffirmed its targets and framed the second-quarter softness as transitory.
The evidence that would validate that view is fairly specific. The record $619 million funded in the second quarter, much of it late in the period, should now generate a full quarter of interest. The effective portfolio yield fell about 80 basis points to 15.0%. Part of that drop came from a nonrecurring first-quarter dividend, and part came from roughly $108 million of early repayments on older loans that lacked the prepayment fees that usually soften the blow. A stabilizing or rebounding yield, together with income per share at or above $0.52, would support the claim that the air pocket has passed. A yield that keeps sliding would point to a more structural problem. Management itself flagged a heavier mix of lower-spread sponsor finance and drag from lower-middle-market joint ventures. If those pressures persist, rising volume may not translate into rising per-share earnings.
Several newer initiatives deserve attention, even though none should swing this quarter alone. The equipment leasing acquisition is meant to add fee income without tying up much balance sheet. The SBIC fund and the Capital Southwest joint venture are both ramping. Managed funds contributed just $0.03 per share last quarter, down from $0.05 a year earlier, so any reversal there would help. Undistributed taxable income has also eroded, from $0.84 to $0.71 per share, which makes dividend coverage more than a cosmetic metric. Credit has been a quiet strength, with non-accruals below 1% of fair value. With equity and warrant positions now around 12% of the portfolio, any shift in that figure matters.
The market has grown skeptical in the meantime. Shares are down 6.3% since the last report, trailing the S&P 500 by nearly five points. Sentiment has flipped from mildly bullish to mildly bearish. At $16.45, the stock sits below its 200-day moving average and closer to the bottom of its post-earnings range of $15.75 to $18.90 than the top. That positioning sets a relatively low bar if income rebounds as promised.
Ultimately, this report hinges on whether record deployment shows up in per-share income. If net investment income clears the dividend with room to spare and yields steady, Trinity's growth narrative stays intact. Another quarter at exactly 100% coverage would leave investors wondering whether scale is coming at the expense of shareholder returns.
This earnings preview was originally published on Earnings Whispers.
This article is for informational purposes only and is not investment advice. Earnings Whispers and its staff may hold positions in the securities mentioned. It is AI-assisted, based on proprietary Earnings Whispers data and company reports, and edited by Earnings Whispers staff.
Mentioned In This Article
Latest News
| Oct-27 | |
| Oct-20 | |
| Oct-20 | |
| Oct-08 | |
| Oct-06 | |
| Sep-30 | |
| Sep-17 | |
| Sep-16 | |
| Sep-10 | |
| Aug-27 | |
| Aug-26 | |
| Aug-05 | |
| Aug-05 | |
| Jul-27 | |
| Jul-14 |
