Trinity Capital Hits Its Number On A Revenue Beat, But Dilution And Fee Income Shape The Quarter
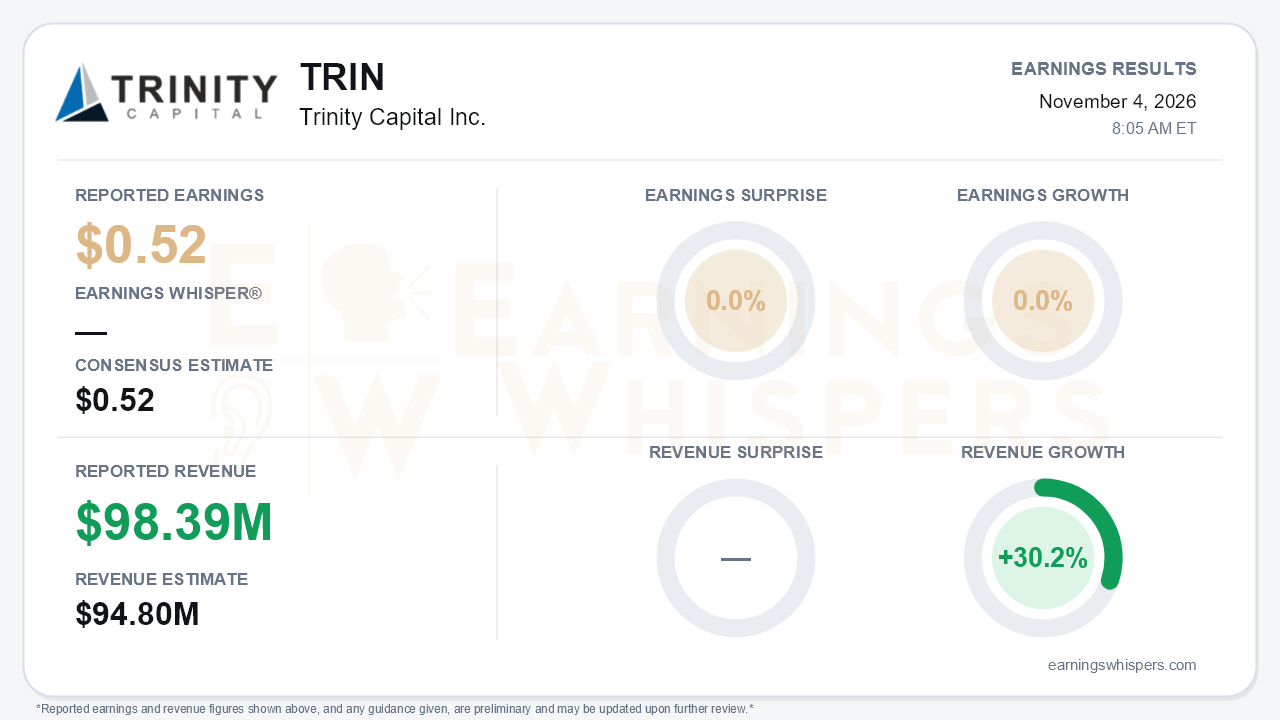
Trinity Capital (NASDAQ: TRIN) delivered a quarter that looks routine at the top line and more interesting underneath. Net investment income of $0.52 per share matched the consensus estimate exactly and was unchanged from a year ago. Total investment income of $98.39 million beat the $94.8 million consensus by 3.8% and grew 30.2% year over year. That gap is the central tension. Revenue grew by nearly a third, yet per-share earnings did not move. The reason is the balance-sheet growth strategy itself. Basic weighted average shares rose to 95.1 million from 71.5 million, so a 34.9% jump in aggregate NII to a record $49.9 million translated into no per-share growth for shareholders.
The quality of the revenue beat deserves scrutiny. Fee and other income surged to $12.4 million from $3.0 million in the year-ago quarter. Interest and dividend income grew a more modest 18% to $86.0 million. The call acknowledged that part of the fee jump was transactional, tied to prepayment and exit fees, and may not recur. The effective yield on debt investments rose to 15.2% from 15.0%, but the company notes that yields include fee accelerations from early repayments. Some of this quarter's strength is therefore activity-driven rather than structural. Below NII, the net increase in net assets from operations improved to $0.49 per share from $0.39. That improvement came largely because net realized losses shrank to $7.5 million from $20.0 million a year earlier, though $7.5 million of realized losses is still a cost.
Sequentially, the call made a credible case that the business re-accelerated:
- **Earnings and income:** NII per share rose from $0.51 in Q2, lifting coverage of the $0.51 quarterly distribution to 103% from 100%. Total investment income climbed from $87 million in Q2.
- **Originations:** Commitments jumped to $880.5 million from $709 million in Q2 and $396 million in Q1. Unfunded commitments rose to $1.4 billion. Management described its pipeline as the largest in company history.
- **Credit:** Non-accruals fell to three companies, or 0.7% of the debt portfolio, from five in Q2. The weighted average risk rating improved to 3.1.
- **NAV:** NAV per share rose to $13.61 from $13.47, helped by accretive ATM issuance.
- **Asset management:** Managed funds contributed $0.05 per share versus $0.03 in Q2. Platform AUM reached $3.4 billion.
Management's tone was notably more confident. It talked about pushing pricing, expecting 2027 spreads to be flat to up, and framing rising rates as a tailwind given floors without ceilings on its floating-rate book.
The forward catalysts lean toward the asset-management model:
- **Desert Star:** A second joint venture with Capital Southwest, focused on sponsor finance, with up to $500 million of capacity.
- **SBIC capacity:** Management raised its incremental SBIC capacity estimate to more than $300 million.
- **Debt funding:** A $350 million issue of 7.5% unsecured notes due 2032 closed in October and was used to pay down the KeyBank facility.
Bears still have legitimate ammunition:
- **Fundings and repayments:** Fundings of $614.1 million were flat against Q2's record. Repayments of $494.8 million remained heavy, creating redeployment drag.
- **Liquidity and spillover:** Platform liquidity fell to $847 million from $939 million. Undistributed taxable income per share kept sliding, to $0.69 from $0.84 three quarters ago.
- **Rising costs:** Expenses allocated to the adviser subsidiary roughly doubled, and compensation costs rose sharply.
- **Exposure risks:** Management flagged AI-related portfolio exposure and policy risk around data center buildout.
The equity-funding dependence is the subtler risk. The growth model relies on issuing stock above NAV. Q3 ATM sales averaged $17.82 per share, but post-quarter sales averaged $16.65, raising just $23.5 million. Issuance is still accretive, but the cushion is narrowing.
The market had already cooled on the story before the report. Shares closed at $17.05 on the eve of earnings, down 2.8% from the $17.55 opening after the August report. They had reached a 52-week high of $18.90 in late August, then slid to an inter-earnings low of $15.75 in mid-October. The stock entered the print near the middle of that range and just 2.1% above its 200-day moving average. Investor sentiment remained mildly positive but softened, slipping to 0.057 from 0.099, a modest rather than dramatic cooling. The Earnings Whispers trend signals were mixed: sequential growth reads positive while AVWAP remains negative. That mix fits a quarter of improving operations against a stock that has given back its summer gains.
The bottom line is that Trinity met expectations on earnings and beat on revenue, while operating momentum, credit quality and NAV all moved in the right direction. However, the per-share result exposes the cost of growing through equity issuance. Some of the revenue upside came from fees that may not repeat. Dividend coverage remains only slightly above 100%, with the spillover cushion shrinking. The record pipeline, new JV capacity and expanding managed-funds contribution give the bulls a real path to per-share growth. Executing on it while the stock's premium to NAV holds up is the test for coming quarters.
Read our earnings preview for Trinity Capital Inc.: https://www.earningswhispers.com/article/TRIN/21751
This earnings review was originally published on Earnings Whispers.
This article is for informational purposes only and is not investment advice. Earnings Whispers and its staff may hold positions in the securities mentioned. It is AI-assisted, based on proprietary Earnings Whispers data and company reports, and edited by Earnings Whispers staff.
Mentioned In This Article
Latest News
| Nov-04 | |
| Nov-04 | |
| Nov-04 | |
| Oct-27 | |
| Oct-20 | |
| Oct-20 | |
| Oct-08 | |
| Oct-06 | |
| Sep-30 | |
| Sep-17 | |
| Sep-16 | |
| Sep-10 | |
| Aug-27 | |
| Aug-26 | |
| Aug-05 |
