Neuronetics Must Prove Its Profit Pivot Holds As Neurostar Revenue Turns Choppier
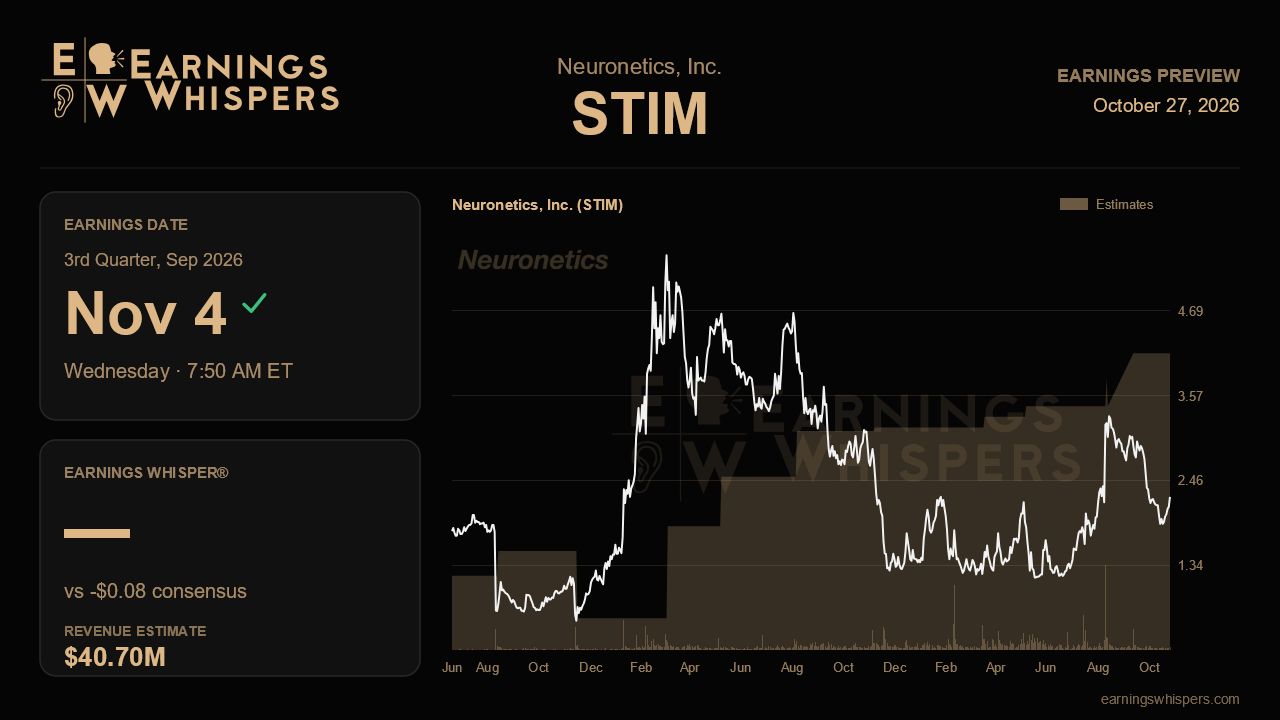
Last quarter Neuronetics gave investors something it had rarely offered before: a quarter of positive adjusted EBITDA, a raised gross margin outlook and a smaller cash burn forecast. The market has since marked the shares down about 18%, while the S&P 500 slipped only about 1%. That gap frames the third-quarter report. The profitability story is gaining traction on paper, but the stock suggests investors doubt it can survive a deliberately messy overhaul of how the company sells its Neurostar systems.
The Street is looking for a loss of 8 cents a share on revenue of about $40.7 million. That would be roughly 9% revenue growth and a much narrower loss than the 13 cents lost a year ago. Sequentially, though, the numbers step backward. Revenue would dip from $41.6 million in the second quarter, and the loss would widen from 5 cents. That fits management's warning that second-half results could be uneven as customers shift between purchase, lease and a la carte support options. Full-year guidance of $160 million to $164 million, trimmed at the top end last quarter, implies about $84 million to $88 million in the back half. Consensus of roughly $160.5 million sits near the bottom of that range, so the bar is modest. A Q3 print near estimates would push the heavier lifting into the fourth quarter.
The central operating question is Neurostar. Revenue from the franchise fell about 3% in the second quarter, its third straight year-over-year decline. Treatment session revenue dropped by double digits. Management attributed roughly half of that to customers working down inventory and the rest to units that went inactive. Session revenue is now folded into a single Neurostar line, so investors lose a clean read on capital sales versus recurring usage. That makes management's commentary on utilization and the inactive base unusually important. Validation would look like a Neurostar line that stabilizes as inventory normalization fades, alongside continued double-digit utilization gains at established accounts. Another decline, especially one that cannot be pinned on inventory, would suggest the installed base is eroding faster than the new commercial models can offset.
Greenbrook, the treatment clinic business, has become the growth engine. It posted $26.9 million in the second quarter, up nearly 17%, with collections running ahead of revenue thanks to better billing and AI-assisted authorizations. Sustaining mid-teens growth there would carry the top line through Neurostar's transition. Margins are the other proof point. Second-quarter gross margin of 51.1% sat above the raised 48% to 50% full-year range, and operating expenses are now guided to $95 million to $100 million. Keeping gross margin near 50% and holding adjusted EBITDA around breakeven despite lower revenue would show that the cost cuts are structural rather than a one-quarter mix benefit. Cash, which rose to $25 million at midyear, should also track the improved burn outlook.
Sentiment has cooled noticeably, falling from solidly bullish heading into the last report to barely positive now. At $2.24, the stock trades above its 200-day average of $1.87 but sits in the lower half of its post-earnings range of $1.84 to $3.44. Heavy leadership turnover, including a new CFO and sales chief, adds execution risk that the market appears to be pricing in.
Ultimately, this report tests whether Neuronetics can tolerate choppier revenue without giving back its margin and cash gains. If Neurostar shows signs of bottoming and profitability metrics hold, the turnaround narrative stays intact. If the core franchise slips again and margins retreat, the profit pivot will look more like a cost-cutting reprieve than a durable recovery.
This earnings preview was originally published on Earnings Whispers.
This article is for informational purposes only and is not investment advice. Earnings Whispers and its staff may hold positions in the securities mentioned. It is AI-assisted, based on proprietary Earnings Whispers data and company reports, and edited by Earnings Whispers staff.
Mentioned In This Article
Latest News
| Oct-27 | |
| Oct-21 | |
| Sep-08 | |
| Aug-11 | |
| Aug-11 | |
| Aug-11 | |
| Aug-11 | |
| Aug-03 | |
| Jul-31 | |
| Jul-28 | |
| Jul-28 | |
| Jul-20 | |
| Jul-06 | |
| Jun-02 | |
| Jun-02 |
