Barings BDC Must Prove Its Lending Rebound Can Outrun NAV Drift And A Looming Debt Maturity
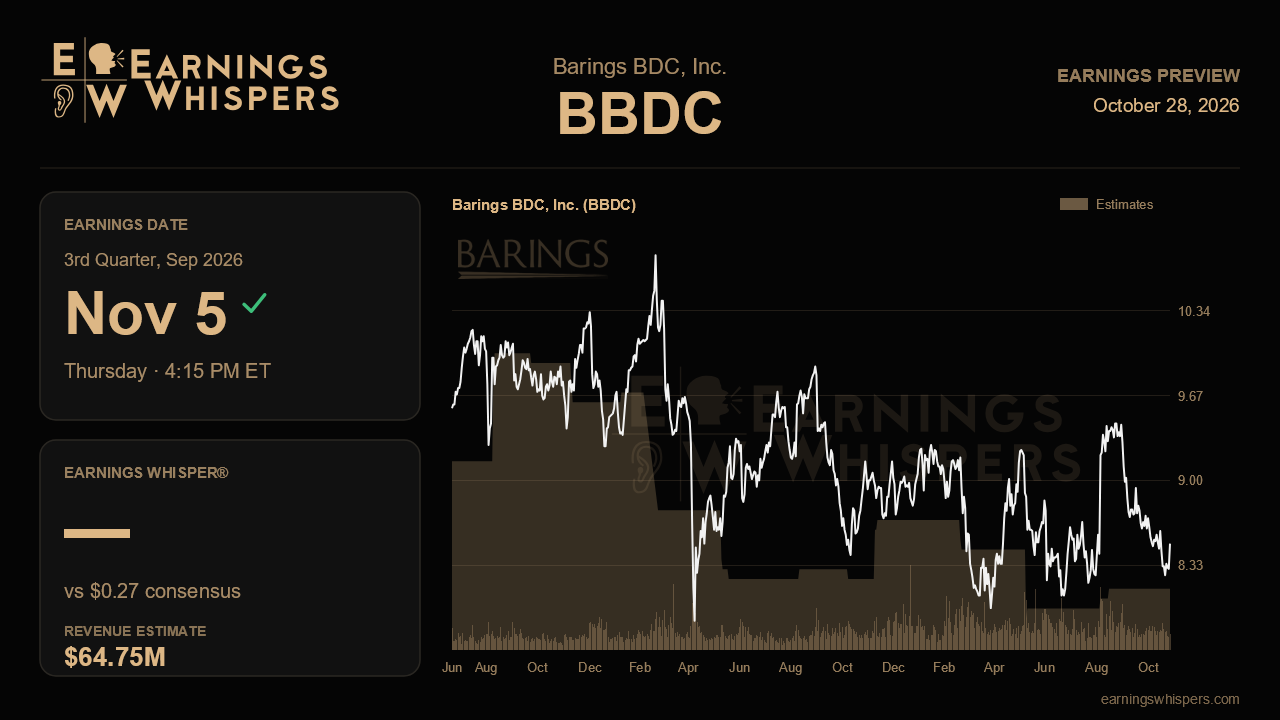
Last quarter Barings BDC finally changed the subject. After several periods spent shrinking its portfolio and cleaning up legacy issues, the lender put money to work again, earned more than its dividend and settled the Sierra credit support agreement that had hung over every prior call. The November 5 report, due after the close, is the first real test of whether that turn was the start of a trend or a single good quarter. Wall Street is leaning cautious, and the gap between management's more confident tone and the Street's flat-to-lower numbers is what makes this release worth watching.
Consensus calls for net investment income of $0.27 per share on revenue of about $64.8 million. That is a penny below the $0.28 posted last quarter and only modestly ahead of the $0.26 quarterly dividend. The year-over-year comparison looks harsh, with EPS expected to fall 15.6% and revenue 10.6%, but the context matters: the year-ago $0.32 was inflated by one-time dividend income from Flywheel, so much of that decline reflects a tough comparison rather than a fresh deterioration. Management has not issued formal guidance, which leaves the dividend coverage ratio as the de facto scorecard.
The central operational question is deployment. Barings swung to roughly $95 million of net originations last quarter, its first positive figure after a string of net repayments, and the portfolio grew to about $2.46 billion. It also freed roughly $67 million from the Sierra settlement to redeploy into income-producing loans. If that capital was put to work during the quarter, a larger earning asset base should, in theory, support NII at or above last quarter's level, which makes the Street's slightly lower estimate look conservative. A second straight quarter of net portfolio growth, alongside a portfolio yield holding near 10.2%, would validate management's claim that slower capital formation across the industry is now delivering wider spreads and better fees to disciplined lenders. Commentary on the Capital Solutions business, where deals have priced 200 to 300 basis points wider than core private credit, would add support. A relapse into net repayments would challenge the whole narrative.
Credit is the other half of the story. Non-accruals excluding the credit support agreement fell to just 0.2% last quarter, but net asset value kept sliding, to $10.94 from $11.02, on markdowns tied to restructurings at EMI, Porta Holdco and Medical Solutions. Four consecutive quarters of modest NAV erosion is a pattern, not noise. Holding NAV steady would go a long way toward convincing skeptics that the watch list is contained, particularly given lingering worries about AI disruption among software borrowers.
Financing deserves equal attention. The $350 million of unsecured notes mature this month, and management has already signaled the unsecured share of funding will decline. How that maturity is handled, and at what cost, will shape future earnings power more than any single quarter's yield.
The market has offered no verdict since the last report. Shares are essentially unchanged, matching the S&P 500, but at $8.50 they sit below the 200-day moving average of $8.69 and in the lower part of the post-earnings range of $8.19 to $9.54, a meaningful discount to book value. Sentiment has soured, with bearish readings climbing to 32.1% from 17.2% a quarter ago. That sets a modest bar. If Barings shows continued net deployment, comfortable dividend coverage, a stable NAV and a credible refinancing plan, the improving story remains intact. If NAV slips again while coverage narrows, the rebound will look more like a pause in a slow decline.
This earnings preview was originally published on Earnings Whispers.
This article is for informational purposes only and is not investment advice. Earnings Whispers and its staff may hold positions in the securities mentioned. It is AI-assisted, based on proprietary Earnings Whispers data and company reports, and edited by Earnings Whispers staff.
Mentioned In This Article
Latest News
| Oct-28 | |
| Oct-07 | |
| Aug-05 | |
| Jul-14 | |
| Jun-01 | |
| May-07 | |
| May-07 | |
| Apr-09 | |
| Feb-20 | |
| Feb-20 | |
| Feb-19 | |
| Feb-19 | |
| Feb-19 | |
| Jan-20 | |
| Nov-13 |
