Eagle Point Credit's NAV Recovery Faces Its Real Test As Shares Trade Far Below Book
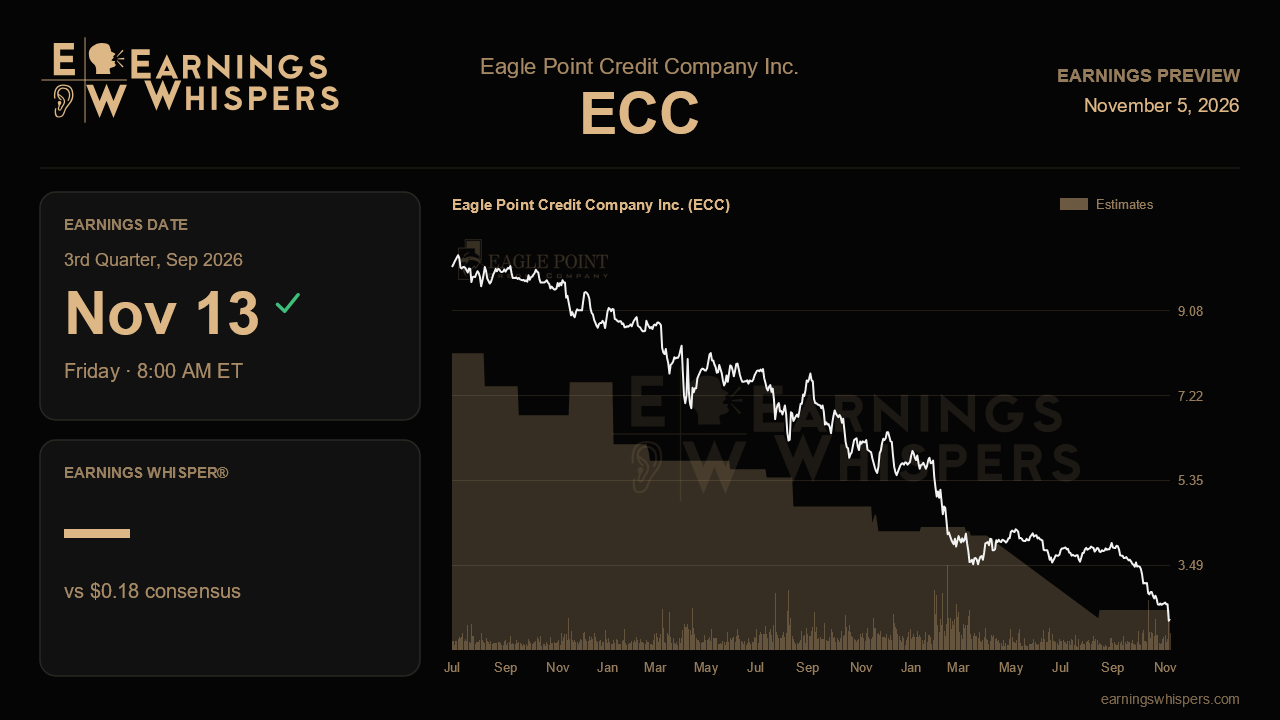
Three months ago, Eagle Point Credit told a recovery story. Net asset value had climbed 8% to $4.51 a share at the end of June, GAAP returns had swung from deeply negative to a positive 12.7% annualized, and management said the loan spread compression that crushed CLO equity for roughly 18 months had largely run its course. The market has since rendered a very different verdict. The stock has fallen about 31% since that report, trailing a roughly flat S&P 500 by nearly 30 points, and at $2.63 it sits more than 40% below that June NAV figure. When ECC reports third-quarter results before the open on November 13, the question is whether the recovery narrative survived the summer or whether the share price was right to doubt it.
On the income line, the bar is modest. Consensus calls for EPS of $0.18, a 25% decline from the $0.24 earned a year ago but a slight step up from the prior quarter's $0.17. Revenue has already contracted sharply, falling to $37.9 million last quarter from $52.0 million in the year-ago period, which reflects both the shrinking cash yields of CLO equity and the reset of the portfolio. The $0.18 estimate lines up neatly with the current $0.06 monthly distribution, so the headline number amounts to a test of whether earnings can cover the payout at its reduced level. A meaningfully better gauge is recurring cash flow, which covered distributions and expenses by $0.14 a share last quarter after falling short in the first quarter. Holding a cushion of that kind would suggest the distribution reset was sized conservatively; slipping back toward a shortfall would revive concerns about another cut.
The bigger issue is NAV. Management already flagged a July estimate of $4.33 to $4.43, roughly a 3% give-back at the midpoint, and the stock's slide toward its post-earnings low of $2.55 implies investors are bracing for more erosion through September. That matters doubly because leverage sat at 47% of assets, essentially unchanged for four quarters and well above the 27.5% to 37.5% target. Any further NAV decline mechanically pushes that ratio higher, narrowing management's flexibility. A quarter-end NAV that holds near the July range would challenge the market's pessimism; a drop toward the low $4s or below would validate it and sharpen questions about deleveraging, for which management has offered no firm timeline.
Several operating claims from the last call also deserve scrutiny. If spread compression has truly abated, the weighted-average loan spread should again look stable, and the amend-and-extend repricing of some software loans should show up as support rather than an anomaly. The trailing default rate improved to 1.0% and look-through exposure to 14 basis points, so any reversal, particularly among software borrowers exposed to AI disruption fears, would undercut the thesis. On the strategic side, the diversification push lifted non-CLO assets to 38% of the portfolio and infrastructure credit to about $112 million; continued growth there, along with early contributions from the newly priced European CLO platform and redeployment at the 24.6% effective yields cited on new investments, would show the pivot is producing earnings rather than just changing the mix.
Sentiment has soured considerably, with the bearish reading now far deeper than it was heading into the last report, and the shares trade well below their 200-day average of $3.88. That pessimism lowers the bar for a relief move, but it also signals that investors want hard evidence rather than tone. The report ultimately hinges on one thing: whether NAV and cash-flow coverage stabilized enough to prove the second-quarter rebound was a turning point, not a pause in a longer decline.
This earnings preview was originally published on Earnings Whispers.
This article is for informational purposes only and is not investment advice. Earnings Whispers and its staff may hold positions in the securities mentioned. It is AI-assisted, based on proprietary Earnings Whispers data and company reports, and edited by Earnings Whispers staff.
Mentioned In This Article
Latest News
| Nov-05 | |
| Oct-29 | |
| Oct-14 | |
| Aug-13 | |
| Aug-12 | |
| Jul-30 | |
| May-19 | |
| May-19 | |
| May-18 | |
| May-12 | |
| May-05 | |
| Apr-06 | |
| Mar-01 | |
| Feb-17 | |
| Feb-17 |
