|
|
|

|
|||||
|
|
|
The Hain Celestial Group, Inc. HAIN has posted third-quarter fiscal 2025 results, with the top and bottom lines declining year over year. Also, both metrics missed the consensus mark. The company has lowered its fiscal 2025 guidance, reflecting ongoing challenges. As a result, its shares have tumbled 47.7% as of yesterday's closing, indicating market concerns.
Despite challenges in the quarter, the company is undergoing a strategic transformation focused on streamlining operations, simplifying its portfolio and prioritizing core categories like Snacks, Baby and Kids products, Tea and Meal Prep. It has initiated a portfolio review to explore options for maximizing shareholder value, alongside efforts to optimize costs, consolidate its distribution network and enhance digital capabilities for stronger market execution. Key priorities include accelerating innovation, strategic pricing and supply-chain productivity.

The Hain Celestial Group, Inc. price-consensus-eps-surprise-chart | The Hain Celestial Group, Inc. Quote
The Zacks Rank #4 (Sell) company posted adjusted earnings of seven cents per share, missing the Zacks Consensus Estimate of 12 cents. The bottom line declined from 13 cents in the year-ago quarter. (Find the latest EPS estimates and surprises on Zacks Earnings Calendar.)
Net sales of $390.4 million missed the consensus estimate of $411 million. The top line declined 11% year over year. Organic sales fell 5% from the year-ago quarter. The decline in organic net sales was due to a three-point drop in the volume/mix and a two-point reduction in price.
The adjusted gross profit was $85.2 million, which fell 12.8% from the year-ago quarter. The adjusted gross margin contracted 50 basis points (bps) from the year-ago quarter to 21.8%.
SG&A expenses were $62.9 million, down 5.7% from $66.7 million in the year-ago quarter. As a percentage of net sales, this metric increased 90 bps year over year to 16.1% in the quarter under review.
Adjusted EBITDA was $33.6 million, down 23.2% from $43.8 million in the year-ago quarter. The adjusted EBITDA margin was 8.6%, down 140 bps year over year. We expected an adjusted EBITDA margin of 11% for the quarter under review.
Net sales in the North America segment tumbled 17% from the year-ago quarter to $222 million, which missed our estimation of $251.6 million. Segmental organic net sales declined 10% year over year, primarily due to reduced sales in the snacks and baby & kids categories. The segment’s adjusted gross profit was $50 million, down 17% year over year, while the adjusted gross margin increased slightly 20 basis points to 22.4%, reflecting productivity gains that were partially offset by increased trade spending and inflation.
Adjusted EBITDA was $17 million, down from $28 million in the prior year, mainly due to lower volume/mix and higher trade spending, although partially offset by productivity improvements. The adjusted EBITDA margin fell to 7.8% compared with 10.4% a year earlier.
The International segment’s net sales fell 1.4% from the year-ago quarter to $168 million, which beat our estimate of $165.8 million. Segmental organic net sales in the fiscal third quarter grew 0.5% year over year. This modest growth was driven by gains in meal preparation and baby & kids categories, as well as improvements in supply-chain performance following prior service disruptions, partially offset by declines in beverages and snacks.
Segment adjusted gross profit fell 7% to $35 million. Adjusted gross margin was 21.1%, down 130 basis points year over year, largely due to inflation, though partially mitigated by productivity enhancements.
Adjusted EBITDA decreased 10% year over year to $22 million, primarily reflecting inflation and pricing pressures, including own label contract impacts, partially offset by favorable volume/mix. The adjusted EBITDA margin declined to 13.2%, representing a drop of 120 basis points from the prior year.
In the Snacks category, organic net sales declined 13% year over year in the fiscal third quarter, primarily due to weaker promotional effectiveness and ongoing softness in the snack category.
In the Baby & Kids category, organic net sales declined 6% from the prior year, due to the loss of a key formula retailer in spring 2024, declining pouch sales and the impact of SKU simplification.
In Beverages, organic net sales were down 7% year over year, primarily due to a continued shift in channel mix for non-dairy beverages in Europe and a delayed start to the hot tea season.
For Meal Prep, organic net sales rose 1% year over year, led by continued growth of soup brands in the UK and increasing yogurt sales in North America.
The company ended the reported quarter with cash and cash equivalents of $44.4 million, long-term debt (excluding the current portion) of $701.4 million and total shareholders’ equity of $696.7 million. Net cash provided by operating activities in the fiscal third quarter was $4.6 million.
Capital expenditure was $7 million in the fiscal third quarter. Capital expenditures are anticipated to remain below $40 million for the year.
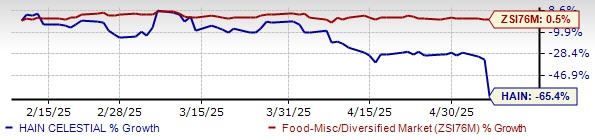
HAIN Stock Past Three-Month Performance
The company is adjusting its full-year outlook in response to a slower-than-anticipated recovery in volume, a softening and volatile macroeconomic environment, and increased investment in promotional activities aimed at supporting brands and driving incremental distribution.
Organic net sales are now expected to decline approximately 5-6% year over year. Previously, the company had expected organic net sales to decline in the band of 2-4%. Similarly, adjusted EBITDA, which was originally projected to remain flat compared with the prior year, is now forecasted at approximately $125 million, indicating a year-over-year decline.
Gross margin, which had been expected to improve at least 90 basis points, is now projected to remain flat at around 21.5%, signaling a setback in anticipated margin expansion. Furthermore, free cash flow expectations have been lowered from at least $60 million to approximately $40 million.
The company continues to prioritize net debt reduction, with a long-term goal of lowering the leverage ratio to 3.0 times adjusted EBITDA or less. These projections take into account current performance trends and the impact of inflationary pressures, trade investments and underperformance in categories like Snacks and Baby & Kids.
Hain Celestial’s shares have lost 65.4% in the past three months against the industry’s 0.5% growth.
We have highlighted three better-ranked stocks, namely United Natural Foods, Inc. UNFI, Canada Goose GOOS and G-III Apparel Group, Ltd. GIII.
United Natural is the leading distributor of natural, organic and specialty food and non-food products. It currently carries a Zacks Rank #2 (Buy). You can see the complete list of today’s Zacks #1 (Strong Buy) Rank stocks here.
UNFI delivered a trailing four-quarter earnings surprise of 408.7%, on average. The consensus estimate for United Natural’s current financial-year sales and earnings indicates growth of 1.9% and 485.7%, respectively, from the year-ago period’s reported figures.
Canada Goose is a global outerwear brand. GOOS is a designer, manufacturer, distributor and retailer of premium outerwear for men, women and children. It carries a Zacks Rank of 2 at present.
The Zacks Consensus Estimate for GOOS’ current fiscal-year earnings and revenues implies declines of 1.4% and 4.9%, respectively, from the year-ago actuals. Canada Goose delivered a trailing four-quarter average earnings surprise of 71.3%.
G-III Apparel is a manufacturer, designer and distributor of apparel and accessories under three types of brands, licensed, owned and private label. It currently carries a Zacks Rank of 2.
The Zacks Consensus Estimate for GIII’s fiscal 2025 earnings and revenues implies declines of 4.5% and 1.2%, respectively, from the year-ago actuals. G-III Apparel delivered a trailing four-quarter average earnings surprise of 117.8%.
Want the latest recommendations from Zacks Investment Research? Today, you can download 7 Best Stocks for the Next 30 Days. Click to get this free report
This article originally published on Zacks Investment Research (zacks.com).
| Apr-01 | |
| Apr-01 | |
| Mar-27 | |
| Mar-26 | |
| Mar-23 | |
| Mar-20 | |
| Mar-19 | |
| Mar-17 |
United Natural Foods to close Sturtevant facility, 443 workers impacted
UNFI
Milwaukee Journal Sentinel
|
| Mar-13 | |
| Mar-13 | |
| Mar-12 | |
| Mar-12 | |
| Mar-12 | |
| Mar-12 | |
| Mar-12 |
Join thousands of traders who make more informed decisions with our premium features. Real-time quotes, advanced visualizations, alerts, and much more.
Learn more about Finviz Elite