|
|
|

|
|||||
|
|
|
Sally Beauty Holdings, Inc. SBH announced mixed results for the second quarter of fiscal 2025. Earnings improved year over year and surpassed the Zacks Consensus Estimate, while revenues declined from the prior-year quarter and fell short of the consensus mark. The revenue shortfall was primarily due to ongoing macroeconomic challenges. In response, management lowered its full-year outlook to better reflect current business conditions.
Sally Beauty’s adjusted earnings were 42 cents per share, which surpassed the Zacks Consensus Estimate of 39 cents per share. The metric increased from 35 cents per share in the year-ago period.
Consolidated net sales of $883.1 million missed the Zacks Consensus Estimate of $901.1 million. The metric fell 2.8% year over year. Adverse currency rates hurt net sales by 110 basis points (bps).
Consolidated comparable sales declined 1.3%, largely due to external challenges such as weather conditions, a harsh flu season and broader macroeconomic uncertainty, which affected consumer spending at Sally Beauty and reduced stylist appointments and related purchases at Beauty Systems Group. However, this was partially offset by strong performance in hair color products and digital marketplace growth at Sally Beauty, along with continued momentum at Beauty Systems Group, driven by expanded distribution channels and innovative new brand launches.
The company operated 22 fewer stores compared to the year-ago quarter. Global e-commerce sales, at constant currency, totaled $94 million, representing 10.7% of consolidated net sales for the quarter.

Sally Beauty Holdings, Inc. price-consensus-eps-surprise-chart | Sally Beauty Holdings, Inc. Quote
In the fiscal second quarter, consolidated gross profit totaled $458.8 million, a decline of 0.9% from $463.1 million in the prior-year quarter. The gross margin improved to 52%, up 100 bps year over year. This margin expansion was primarily driven by reduced distribution and freight costs, lower shrink expenses across both business segments and increased product margins at Sally Beauty.
The company’s adjusted selling, general and administrative (SG&A) expenses for the quarter totaled $383.7 million, reflecting a $10.8 million year-over-year decrease. This reduction was primarily driven by favorable foreign currency exchange impacts, $3.9 million in cost savings from the Fuel for Growth initiative, and reduced advertising and depreciation expenses. Adjusted SG&A expenses, as a percentage of sales, remained flat year over year at 43.4%.
Adjusted operating earnings were $75.2 million, up from $68.6 million in the year-ago quarter. The adjusted operating margin expanded to 8.5% from 7.6% reported in the year-ago quarter.
Adjusted EBITDA was $104.8 million, representing a rise of 5.3% from the previous year. The adjusted EBITDA margin was 11.9%, indicating an increase of 90 bps from the prior-year period.
Sally Beauty Supply: Net sales in the segment went down 2.5% year over year to $500.6 million. Adverse foreign exchange movements had a negative impact of 150 bps on sales. Segmental comparable sales inched down 0.3% in the quarter due to strong growth in hair color and digital marketplaces, countered by declines in hair care. The net store count at the end of the quarter was 3,117. Segmental e-commerce sales at cc were $41 million, contributing 8.2% to the segment’s net sales.
Beauty Systems Group: Net sales in the segment decreased 3.2% year over year to $382.6 million. Currency headwinds hurt sales by 50 bps. Segment comparable sales declined by 2.7%, primarily due to softer performance in the hair care category. This was partially offset by sustained growth momentum driven by expanded distribution channels and the introduction of innovative new brands. The net store count at the end of the quarter was 1,329. Total distributor sales consultants at the end of the quarter were 632 compared with 654 in the year-ago period. Segmental e-commerce sales at cc were $53 million, contributing 13.9% to the segment’s net sales.
The Zacks Rank #3 (Hold) company ended the fiscal second quarter with cash and cash equivalents of $92.2 million, long-term debt, including capital leases, of $902.8 million and total stockholders’ equity of $699.8 million. The inventory was $1.01 billion.
In the fiscal second quarter, the company provided cash flow from operations of $51 million. The operating free cash flow was $32 million.
In the quarter, the company used cash flow to repay $36 million of Term Loan B debt and repurchase 1.1 million shares under its share repurchase program for a total cost of $10 million. SBH ended the quarter with a net debt leverage ratio of 1.8x.
On May 6, 2025, the company approved a four-year extension of its share repurchase program, now set to expire on Sept. 30, 2029. Under this extension, management remains authorized to repurchase its common stock up to the remaining amount under the original 2017 authorization, which currently stands at $501.1 million.
In light of ongoing global trade policy complexities and their potential impact on consumer sentiment and spending, the updated outlook does not factor in any significant changes to the macroeconomic environment or overall consumer demand trends.
For fiscal 2025, comparable sales are projected to range from flat to a 1% decline year over year. Consolidated net sales are anticipated to be nearly 75 bps lower than comparable sales, primarily due to the expected unfavorable impact of foreign exchange rates. The company expects its adjusted operating margin to fall within the range of 8% to 8.5% for fiscal 2025. The company had earlier expected comparable sales to range from flat to up 2% year over year, with an adjusted operating margin between 8.5% and 9% for fiscal 2025.
In the third quarter of fiscal 2025, Sally Beauty’s comparable sales are expected to be flat to down 2% year over year. Consolidated net sales are projected to be nearly 50 bps lower than comparable sales, reflecting anticipated headwinds from unfavorable foreign exchange rates. Adjusted operating margin for the fiscal third quarter is expected to range between 8% and 8.5%.
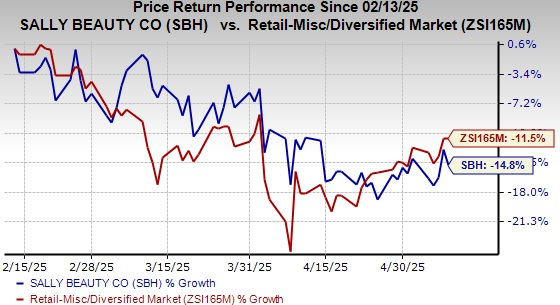
SBH stock has lost 14.8% in the past three months compared with the industry’s decline of 11.5%.
Nordstrom, Inc. JWN operates as a fashion retailer in the United States. The company provides apparel, shoes, beauty, accessories and home goods for women, men, young adults and children. It currently carries a Zacks Rank #2 (Buy). Nordstrom delivered an earnings surprise of 22.2% in the last reported quarter. You can see the complete list of today’s Zacks #1 Rank (Strong Buy) stocks here.
The Zacks Consensus Estimate for JWN’s current fiscal-year sales and earnings indicates growth of 2.2% and 1.8%, respectively, from the year-ago reported figures.
G-III Apparel Group, Ltd. GIII designs, sources, distributes and markets women's and men's apparel in the United States and internationally. It carries a Zacks Rank #2 at present. G-III Apparel delivered a trailing four-quarter average earnings surprise of 117.8%.
The Zacks Consensus Estimate for GIII’s current fiscal-year earnings and revenues implies declines of 4.5% and 1.2%, respectively, from the year-ago actuals.
Kontoor Brands, Inc. KTB, a lifestyle apparel company that designs, produces, procures, markets, distributes and licenses denim, apparel, footwear and accessories, primarily under the Wrangler and Lee brands, currently carries a Zacks Rank #2. KTB delivered a trailing four-quarter average earnings surprise of 8.1%.
The Zacks Consensus Estimate for Kontoor Brands’ current fiscal year’s earnings indicates growth of 1.1% from the year-ago actuals.
Want the latest recommendations from Zacks Investment Research? Today, you can download 7 Best Stocks for the Next 30 Days. Click to get this free report
This article originally published on Zacks Investment Research (zacks.com).
| Feb-19 | |
| Feb-17 | |
| Feb-17 | |
| Feb-16 | |
| Feb-13 | |
| Feb-12 | |
| Feb-12 | |
| Feb-10 | |
| Feb-10 | |
| Feb-10 | |
| Feb-10 | |
| Feb-10 | |
| Feb-10 | |
| Feb-09 | |
| Feb-09 |
Join thousands of traders who make more informed decisions with our premium features. Real-time quotes, advanced visualizations, backtesting, and much more.
Learn more about FINVIZ*Elite