|
|
|

|
|||||
|
|
|
Greif, Inc. GEF is scheduled to release second-quarter fiscal 2025 financial numbers after the closing bell on June 4.
The Zacks Consensus Estimate for Greif’s total revenues for the quarter is pegged at $1.43 billion, indicating a 4% rise from the year-ago quarter’s reported level.
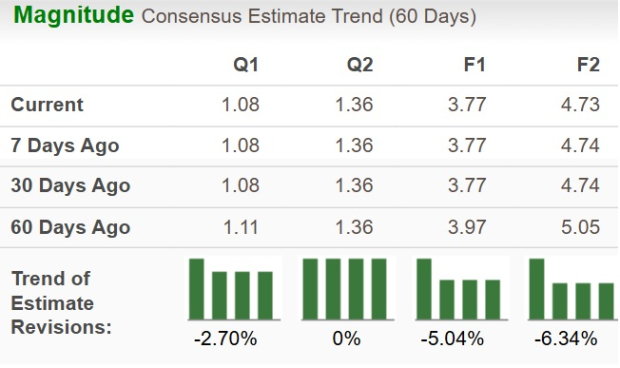
The consensus mark for earnings is currently $1.08 per share, indicating a 31.7% increase from the year-ago reported number. Earnings estimates have moved down 2.7% in the past 60 days.
GEF’s earnings outpaced the Zacks Consensus Estimates in two of the trailing four quarters while missing twice, the average surprise being a negative 11.67%. This is depicted in the following chart.
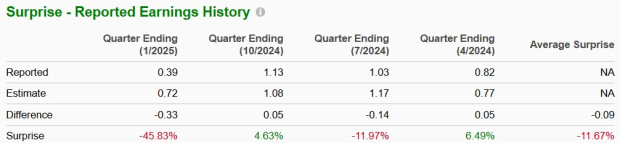
(Find the latest earnings estimates and surprises on Zacks Earnings Calendar.)
In the first quarter of fiscal 2025, Greif reported a 0.9% year-over-year improvement in volumes driven by gains across three segments- Customized Polymer Solutions, Sustainable Fiber Solutions and Integrated Solutions. This strength helped offset lower volumes in the Durable Metal Solutions segment. Pricing had a 2.2% favorable impact while acquisitions (net by divestiture impact) added 3.9% to the revenue growth.
For the second quarter, we anticipate similar trends and our model projects total revenue growth to be supported by 0.8% volume growth, 1.3% favorable pricing and a 3.4% contribution from acquisitions, partially offset by a 1.9% negative impact from foreign currency translation.
In the Customized Polymer Solutions segment, volume rose 2.7% in the first quarter, led by low-teens growth in small containers and low single-digit growth in Intermediate Bulk Containers (IBC), offset by mid-single-digit decline in large containers. The segment benefited from stronger demand in the agricultural and food and beverage end markets. Pricing was up 3.7%, offset by a 2.6% unfavorable foreign currency impact. Recent acquisitions contributed a substantial 25.7% increase to revenue growth.
Our model projects 2.2% growth for the Customized Polymer Solutions segment for the second quarter and pricing to be a favorable 2.1%. Acquisitions are expected to contribute 20.5% to the growth, with unfavorable currency impact expected to hurt revenues by 1.7%.
As a result, segment revenues are projected to reach $351.5 million in the second quarter, up 23.1% from $285.6 million in the prior-year quarter. Adjusted EBITDA is expected to grow 11.9%, reaching $39.1 million compared with $34.9 million a year ago.
In the Durable Metal Solutions segment, volumes were down 2.8% in the first quarter. Higher demand in EMEA is being offset by continued softness in North America. Industrial end markets such as bulk chemicals and petrochemicals continue to be a drag on volumes.
For the second quarter, our model projects a 2% drop in volumes, 0.2% unfavorable pricing and 4.5% negative foreign currency impact. This is expected to result in a 6.7% year-over-year decline in the segment’s revenues to $386 million. The segment’s adjusted EBITDA is expected at $64 million, 0.8% lower than the prior-year quarter’s $64.5 million.
The Sustainable Fiber Solutions segment’s volumes grew 1.4% year over year. Improving trends in containerboard and uncoated recycled paperboard and strong demand for bulk boxes and partitions are likely to have been offset by mixed demand for conventional sheets.
Our model projects the segment’s revenues at $603.8 million for the second quarter, up 4.1% year over year. This will likely be driven by 1.1% growth in volumes and 3.1% favorable price impact, offset by a negative 0.2% foreign currency impact. The segment’s adjusted EBITDA is expected at $60.7 million, up 22.7% from the prior-year quarter’s $49.5 million.
The Integrated Solutions segment’s revenues are projected at $80.8 million for the second quarter, a 11.7% drop compared with $91.6 million in the year-ago quarter. In the first quarter, volume growth was 11.2% and we expect 7.4% volume growth in the second quarter. This reflects strength in key product groups (paints, linings, adhesives and caps/closures). However, this gain will be offset by an unfavorable pricing of 5.4%, a negative 1.3% impact of foreign currency and a 12.3% impact from the Delta divestiture. Adjusted EBITDA is $25.1 million compared with the year-earlier quarter’s $20.8 million.
Gains from the company’s efforts toward SG&A rationalization, network optimization and operating efficiency gains are likely to lead to a 10.8% year-over-year improvement in adjusted EBITDA to $188 million in the second quarter.
Our proven model doesn’t conclusively predict an earnings beat for Greif this season. The combination of a positive Earnings ESP and a Zacks Rank #1 (Strong Buy), 2 (Buy) or 3 (Hold) increases the odds of an earnings beat. But that’s not the case here.
You can uncover the best stocks before they’re reported with our Earnings ESP Filter.
Earnings ESP: The Earnings ESP for Greif is 0.00%.
Zacks Rank: Greif currently carries a Zacks Rank of 3.
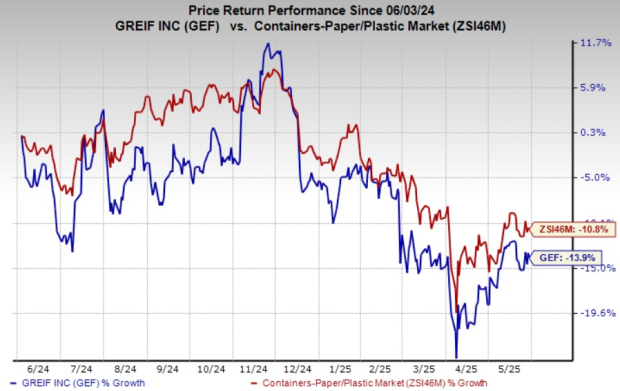
Greif’s shares have declined 13.9% in the past year compared with the industry’s fall of 10.8%.
Here are some stocks worth considering, as these have the right combination of elements to post an earnings beat in the upcoming releases.
Broadcom AVGO is scheduled to release second-quarter fiscal 2025 results on June 5, 2025. The company has an Earnings ESP of +1.27% and currently carries a Zacks Rank of 2. You can see the complete list of today’s Zacks #1 Rank stocks here.
The Zacks Consensus Estimate for AVGO’s revenues is pegged at $14.9 billion, indicating year-over-year growth of 19.5%. The estimate for earnings is at $1.57 per share, indicating a 42.7% increase from the year-ago quarter’s reported level. AVGO has a trailing four-quarter average earnings surprise of 3.44%.
lululemon athletica LULU is set to release its first-quarter fiscal 2025 results on June 5. LULU currently has an Earnings ESP of +1.82% and a Zacks Rank of 3.
The Zacks Consensus Estimate for its quarterly revenues is pegged at $2.36 billion, indicating 6.7% growth from the figure reported in the year-ago quarter.
The consensus estimate for LULU’s earnings is at $2.58 per share, which indicates 1.6% growth from the year-ago quarter’s actual. LULU has a trailing four-quarter earnings surprise of 6.6%, on average.
Victoria's Secret & Co. VSCO will report first-quarter fiscal 2025 earnings on June 5. The company currently has an Earnings ESP of +54.55% and a Zacks Rank of 3.
The Zacks Consensus Estimate for current-quarter earnings per share is pegged at four cents, indicating a 67% plunge year over year. Victoria's Secret's quarterly revenues are pegged at $1.33 billion, which indicates a decline of 2.1% from the prior-year quarter. VSCO delivered a trailing four-quarter earnings surprise of 12.3%, on average.
Want the latest recommendations from Zacks Investment Research? Today, you can download 7 Best Stocks for the Next 30 Days. Click to get this free report
This article originally published on Zacks Investment Research (zacks.com).
| Jul-17 | |
| Jul-17 | |
| Jul-17 | |
| Jul-17 | |
| Jul-17 | |
| Jul-17 | |
| Jul-17 | |
| Jul-17 | |
| Jul-17 | |
| Jul-17 | |
| Jul-17 | |
| Jul-17 | |
| Jul-17 | |
| Jul-16 | |
| Jul-16 |
Join thousands of traders who make more informed decisions with our premium features. Real-time quotes, advanced visualizations, alerts, and much more.
Learn more about Finviz Elite