|
|
|

|
|||||
|
|
|

RV manufacturer Thor Industries (NYSE:THO) reported revenue ahead of Wall Street’s expectations in Q1 CY2025, with sales up 3.3% year on year to $2.89 billion. Its GAAP profit of $2.53 per share was 40.7% above analysts’ consensus estimates.
Is now the time to buy THOR Industries? Find out by accessing our full research report, it’s free.
“Our third quarter results exceeded our expectations on both the top and bottom lines. The successful execution of key strategic initiatives, in particular placing further emphasis on driving down our cost profile, led to improved margins in an environment where we saw modest year-over-year top-line improvement. THOR’s operating model, particularly within North America, is designed to ramp upward and downward in an incredibly efficient manner, and our performance in the fiscal third quarter exhibited the strength and flexibility of this operating model. We are incredibly proud of our hard-working team members as they continue to execute to plan in the face of numerous challenging market conditions as we navigate through this prolonged industry downturn together. Our third quarter performance exemplifies what makes THOR the market leader. History has proven THOR’s ability to weather difficult macroeconomic circumstances and to come back stronger when market conditions improve. While the current level of uncertainty is unprecedented, and we believe the next two fiscal quarters will be challenging for the RV industry as a whole, we are very pleased that our efforts are starting to move the needle,” stated Bob Martin, President and Chief Executive Officer of THOR Industries.
Created through the acquisition and merger of various RV manufacturers, THOR Industries manufactures and sells a range of recreational vehicles, including motorhomes and travel trailers, catering to consumers seeking the freedom and comfort of the RV lifestyle.
Reviewing a company’s long-term sales performance reveals insights into its quality. Any business can have short-term success, but a top-tier one grows for years. Over the last five years, THOR Industries grew its sales at a sluggish 3.3% compounded annual growth rate. This fell short of our benchmark for the industrials sector and is a poor baseline for our analysis.
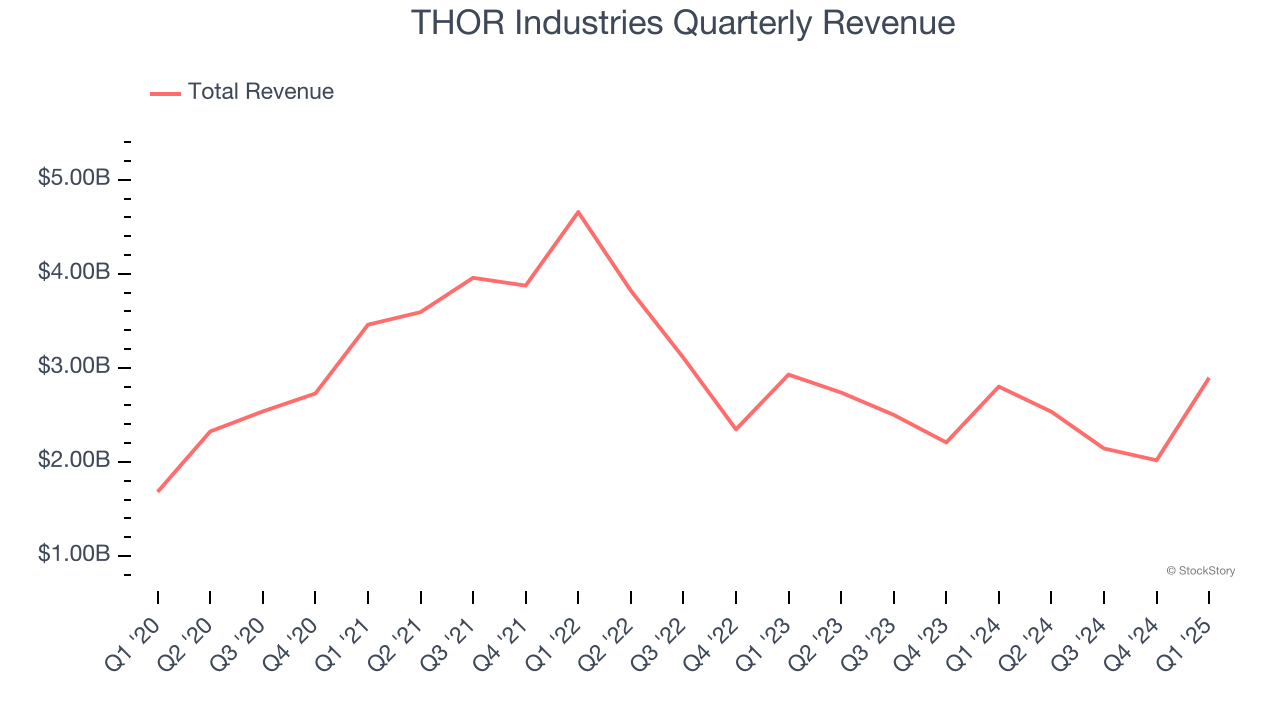
We at StockStory place the most emphasis on long-term growth, but within industrials, a half-decade historical view may miss cycles, industry trends, or a company capitalizing on catalysts such as a new contract win or a successful product line. THOR Industries’s performance shows it grew in the past but relinquished its gains over the last two years, as its revenue fell by 11.4% annually.
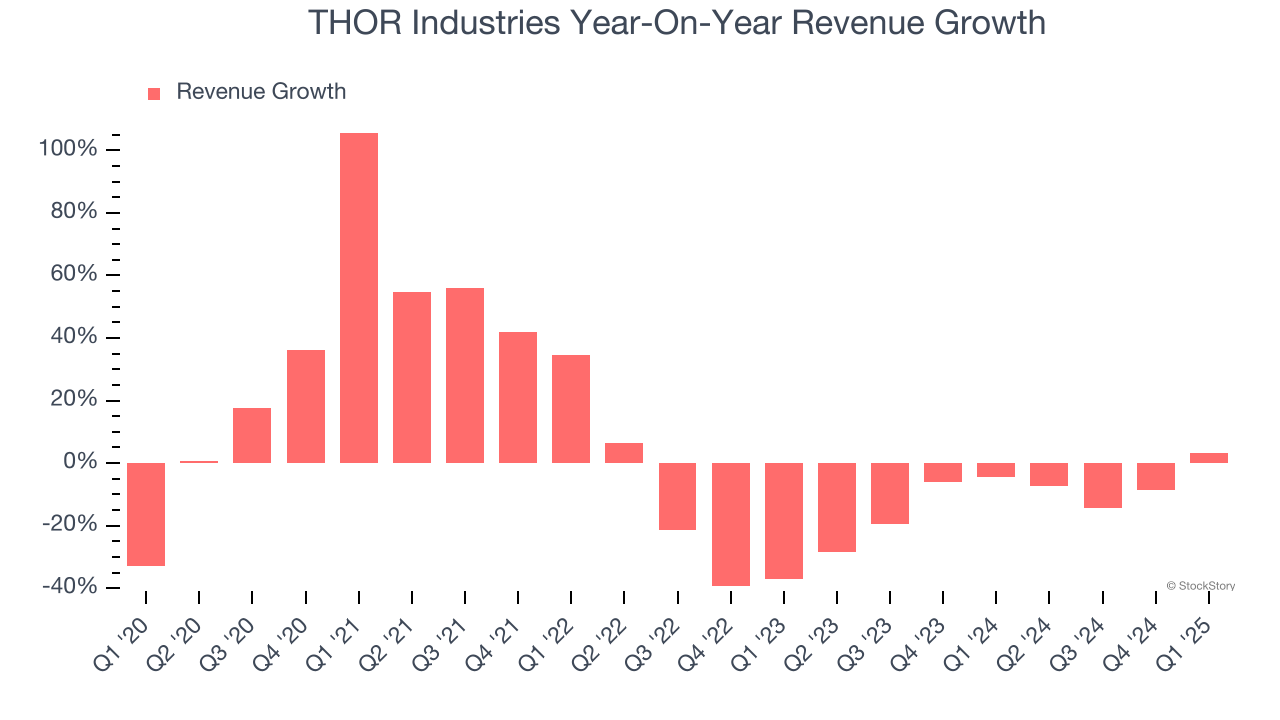
This quarter, THOR Industries reported modest year-on-year revenue growth of 3.3% but beat Wall Street’s estimates by 10.1%.
Looking ahead, sell-side analysts expect revenue to grow 1.6% over the next 12 months. Although this projection implies its newer products and services will spur better top-line performance, it is still below the sector average.
Unless you’ve been living under a rock, it should be obvious by now that generative AI is going to have a huge impact on how large corporations do business. While Nvidia and AMD are trading close to all-time highs, we prefer a lesser-known (but still profitable) stock benefiting from the rise of AI. Click here to access our free report one of our favorites growth stories.
Operating margin is one of the best measures of profitability because it tells us how much money a company takes home after procuring and manufacturing its products, marketing and selling those products, and most importantly, keeping them relevant through research and development.
THOR Industries was profitable over the last five years but held back by its large cost base. Its average operating margin of 6.5% was weak for an industrials business. This result isn’t too surprising given its low gross margin as a starting point.
Looking at the trend in its profitability, THOR Industries’s operating margin decreased by 3.1 percentage points over the last five years. This raises questions about the company’s expense base because its revenue growth should have given it leverage on its fixed costs, resulting in better economies of scale and profitability. THOR Industries’s performance was poor no matter how you look at it - it shows that costs were rising and it couldn’t pass them onto its customers.
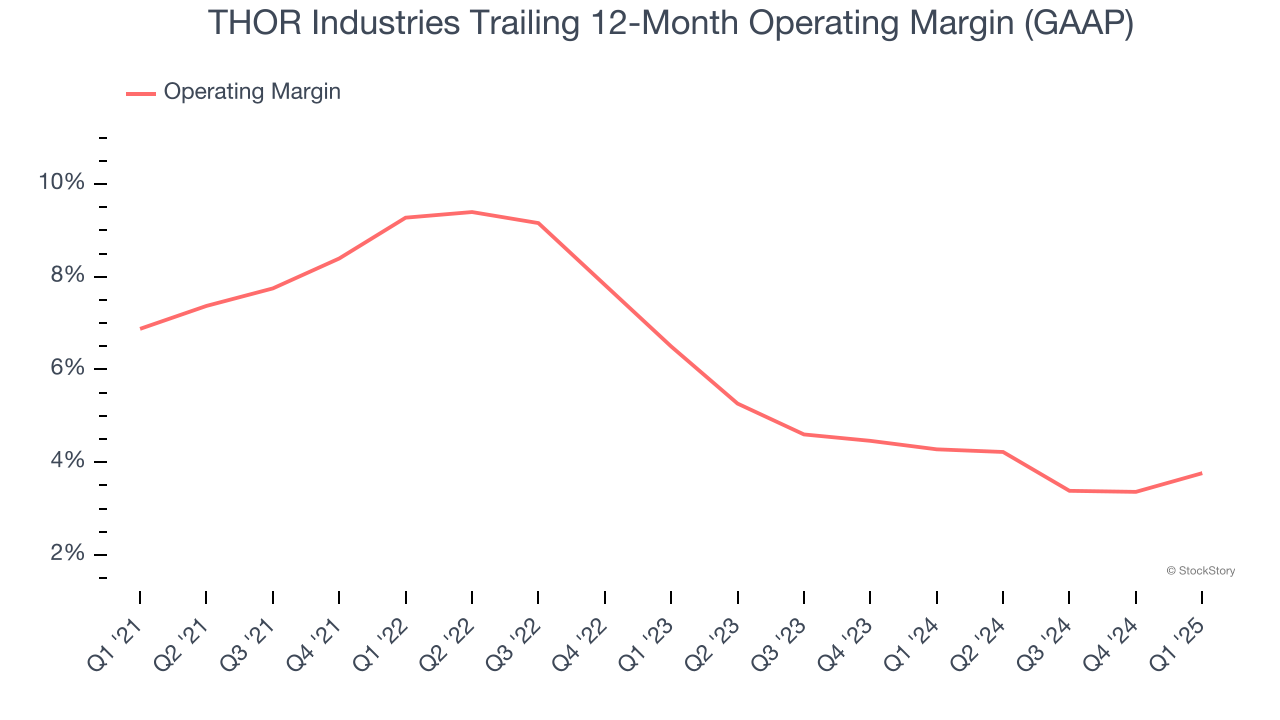
In Q1, THOR Industries generated an operating margin profit margin of 7.1%, up 1.3 percentage points year on year. The increase was encouraging, and because its operating margin rose more than its gross margin, we can infer it was more efficient with expenses such as marketing, R&D, and administrative overhead.
We track the long-term change in earnings per share (EPS) for the same reason as long-term revenue growth. Compared to revenue, however, EPS highlights whether a company’s growth is profitable.
THOR Industries’s weak 3.3% annual EPS growth over the last five years aligns with its revenue performance. This tells us it maintained its per-share profitability as it expanded.
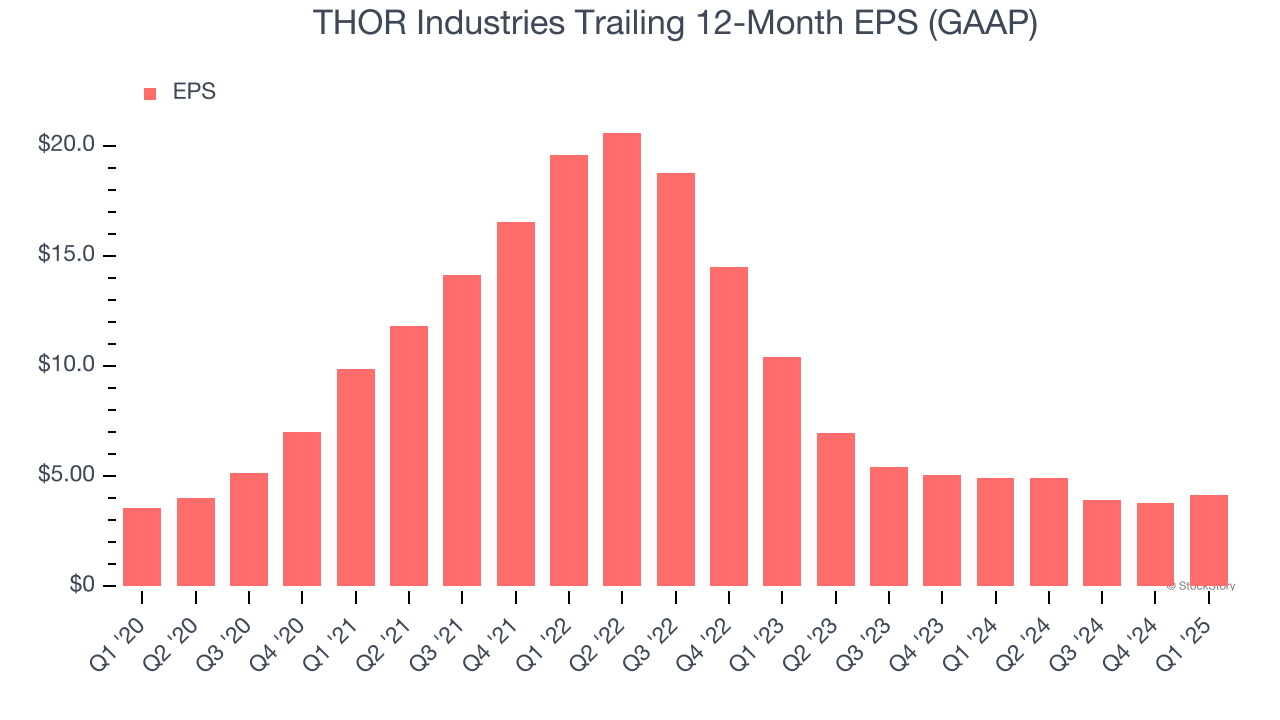
Like with revenue, we analyze EPS over a more recent period because it can provide insight into an emerging theme or development for the business.
For THOR Industries, its two-year annual EPS declines of 36.8% show it’s continued to underperform. These results were bad no matter how you slice the data.
In Q1, THOR Industries reported EPS at $2.53, up from $2.13 in the same quarter last year. This print easily cleared analysts’ estimates, and shareholders should be content with the results. Over the next 12 months, Wall Street expects THOR Industries’s full-year EPS of $4.17 to grow 14.7%.
We were impressed by how significantly THOR Industries blew past analysts’ revenue, EPS, and EBITDA expectations this quarter. Zooming out, we think this was a solid print. The stock traded up 13% to $93 immediately following the results.
THOR Industries may have had a good quarter, but does that mean you should invest right now? If you’re making that decision, you should consider the bigger picture of valuation, business qualities, as well as the latest earnings. We cover that in our actionable full research report which you can read here, it’s free.
| Mar-10 | |
| Mar-09 | |
| Mar-04 | |
| Mar-03 | |
| Mar-03 | |
| Mar-03 | |
| Mar-03 | |
| Mar-03 | |
| Mar-03 | |
| Mar-03 | |
| Mar-03 | |
| Mar-03 | |
| Mar-02 | |
| Mar-02 | |
| Feb-27 |
Join thousands of traders who make more informed decisions with our premium features. Real-time quotes, advanced visualizations, backtesting, and much more.
Learn more about Finviz Elite