|
|
|

|
|||||
|
|
|
The J. M. Smucker Company SJM reported fourth-quarter fiscal 2025 results, with the top line missing the Zacks Consensus Estimate but the bottom line exceeding the same. However, both metrics declined year over year.
SJM’s fiscal fourth-quarter results reflect the impact of several key transactions, including the divestiture of certain Sweet Baked Snacks value brands (March 3, 2025), the divestiture of the Voortman business (Dec. 2, 2024), the divestiture of the Canada condiment business (Jan. 2, 2024), the acquisition of Hostess Brands (Nov. 7, 2023) and the divestiture of the Sahale Snacks business (Nov. 1, 2023).
Adjusted earnings of $2.31 per share decreased 13% year over year. However, the bottom line surpassed the Zacks Consensus Estimate of $2.25. (Find the latest EPS estimates and surprises on Zacks Earnings Calendar.)

The J. M. Smucker Company price-consensus-eps-surprise-chart | The J. M. Smucker Company Quote
Net sales amounted to $2,143.8 million, which fell 3% year over year and missed the Zacks Consensus Estimate of $2,191 million. Excluding noncomparable net sales of last year associated with divestitures as well as currency movements, the top line dipped 1%. The downtick in comparable net sales can be attributed to the lower volume/mix (down 3%), partly made up by net price realization (up 3%).
The gross profit went down 10% due to elevated costs, unfavorable volume/mix and the noncomparable impact of divestitures, partially offset by better net price realization. The adjusted gross profit fell 9%.
The adjusted operating income fell 8% year over year to $422.4 million.
U.S. Retail Pet Foods: The segment’s sales fell 13% to $395.5 million. The volume/mix had an 11-percentage-point adverse impact on net sales, while net price realization decreased the metric by 2 percentage points. The segment’s profit decreased 7% to $106.1 million. The Zacks Consensus Estimate for segment sales was pegged at $434 million.
U.S. Retail Coffee: The segment’s sales grew 11% to $738.6 million, backed by higher net price realization (up 10%), while volume/mix remained neutral. The segment’s profit went up $0.9 million to $211.2 million. The consensus estimate for segment sales was pegged at $715 million.
U.S. Retail Frozen Handheld and Spreads: Sales in the segment decreased $0.7 million to $449.8 million, while the consensus mark was $462 million. The volume/mix boosted net sales by 1 percentage point and the net price realization decreased the metric by 1 percentage point. The segment’s profit tumbled 5% to $91 million.
Sweet Baked Snacks: Sales in the segment were $251 million, down 26% year over year. Excluding noncomparable sales related to divestitures, net sales declined 14%. Both volume/mix and net price realization had an adverse impact on net sales. The consensus estimate for segment sales was pegged at $270 million. Segment profit slumped 72% to $20 million in the quarter.
International and Away From Home: Net sales increased 3% to $308.9 million compared with the Zacks Consensus Estimate of $311 million. Excluding unfavorable foreign currency exchange, net sales grew 4%. The volume/mix had a 1-percentage-point negative effect and the net price realization had a positive impact of 6 percentage points on net sales. The segment’s profit increased 13% to $69.2 million.
The J. M. Smucker exited the quarter with cash and cash equivalents of $69.9 million, long-term debt (net of current portion) of $7,036.8 million and total shareholders’ equity of $6,082.6 million.
Cash flow provided by operating activities amounted to $393.9 million for the three months ended April 30, 2025. Free cash flow was $298.9 million in the same time frame.
Free cash flow and capital expenditures are likely to be $875 million and $325 million, respectively, in fiscal 2026.
Fiscal 2026 net sales are anticipated to increase in the range of 2% to 4%. This includes an impact related to the divestitures of the Voortman business and certain Sweet Baked Snacks value brands.
SJM anticipates comparable net sales to increase approximately 3.5-5.5%, excluding noncomparable sales from Voortman divestitures and certain Sweet Baked Snacks brands. The growth reflects higher net price realization, partially offset by volume/mix declines. This guidance also accounts for a $38-million decline in contract manufacturing sales following the end of the pet food brand agreement in fiscal 2025.
The adjusted EPS for fiscal 2026 is envisioned in the band of $8.50 to $9.50. The company recorded an adjusted EPS of $10.12 in fiscal 2025. The bottom-line guidance takes into account an adjusted gross profit margin of about 35.5-36% and a roughly 3% rise in SD&A expenses.
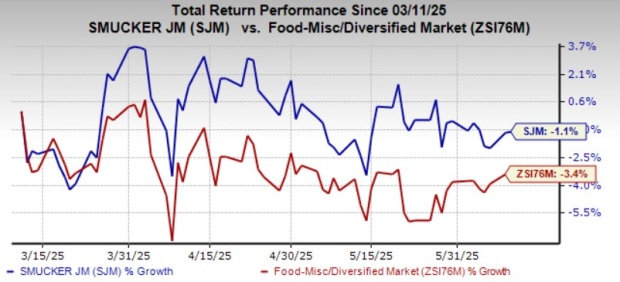
Shares of this Zacks Rank #3 (Hold) company have tumbled 1.1% over the past three months compared with the industry’s decline of 3.4%.
Nomad Foods NOMD, which manufactures frozen foods, sports a Zacks Rank #1 (Strong Buy) at present. You can see the complete list of today’s Zacks #1 Rank stocks here.
NOMD delivered a trailing four-quarter earnings surprise of 3.2%, on average. The Zacks Consensus Estimate for Nomad Foods’ current financial-year sales and earnings implies growth of 4.6% and 7.3%, respectively, from the year-ago number.
Oatly Group AB OTLY, an oatmilk company, provides a range of plant-based dairy products made from oats. It presently has a Zacks Rank of 2 (BUY). OTLY delivered a trailing four-quarter earnings surprise of 25.1%, on average.
The consensus estimate for Oatly Group’s current fiscal-year sales and earnings implies growth of 2.7% and 65.8%, respectively, from the year-ago figures.
BRF S.A. BRFS raises, produces and slaughters poultry and pork for the processing, production and sale of fresh meat, processed products, pasta, margarine, pet food and other products. It currently carries a Zacks Rank #2. BRFS delivered a trailing four-quarter earnings surprise of 5.4%, on average.
The Zacks Consensus Estimate for BRF S.A.'s current fiscal-year sales and earnings implies growth of 0.3% and 11.1%, respectively, from the prior-year levels.
Want the latest recommendations from Zacks Investment Research? Today, you can download 7 Best Stocks for the Next 30 Days. Click to get this free report
This article originally published on Zacks Investment Research (zacks.com).
| Jul-21 | |
| Jul-20 | |
| Jul-20 | |
| Jul-20 | |
| Jul-20 | |
| Jul-17 | |
| Jul-17 | |
| Jul-15 | |
| Jul-09 | |
| Jul-07 | |
| Jun-28 | |
| Jun-25 | |
| Jun-24 | |
| Jun-17 | |
| Jun-09 |
The Corners of the Market Where Investors Are Riding Out Turbulence in Chip Stocks
SJM +10.44%
The Wall Street Journal
|
Join thousands of traders who make more informed decisions with our premium features. Real-time quotes, advanced visualizations, alerts, and much more.
Learn more about Finviz Elite