|
|
|

|
|||||
|
|
|
The Procter & Gamble Company PG stock recently slipped below its 50-day simple moving average (SMA), indicating a short-term bearish trend. On June 10, 2025, the PG stock closed at $162.84, staying below the 50-day SMA of $163.91. The stock of this consumer goods behemoth has been witnessing a significant downtrend in the past three months, which resulted in a fall below the 50-day SMA on June 6, 2025. Since then, Procter & Gamble’s stock has been declining.
Before this, the PG stock sloped below its 200-day moving average on June 4, 2025, and has been trading below the mark since then, indicating a possible long-term downward trend as well.
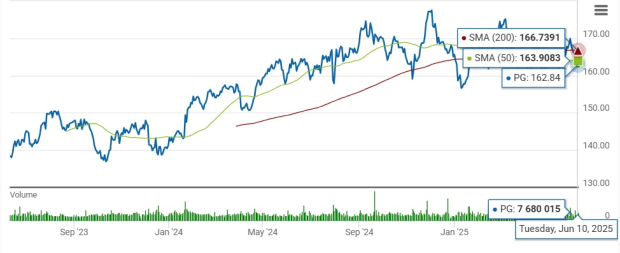
The 50-day SMA is a key indicator for traders and analysts to identify support and resistance levels. It is considered particularly important as it is the first marker of an uptrend or a downtrend. SMA is an essential tool in technical analysis that helps investors evaluate price trends by smoothing out short-term fluctuations. This approach provides a clearer perspective on a stock's long-term direction.
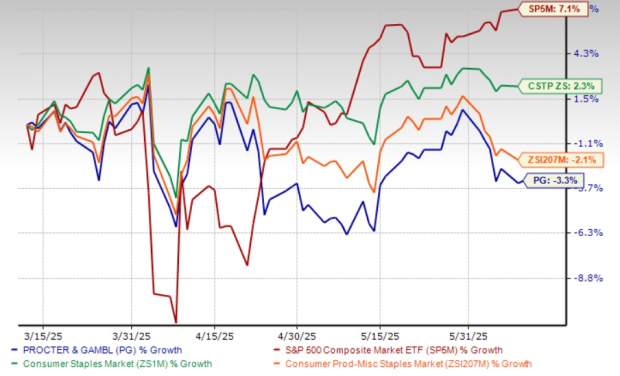
Procter & Gamble has shown a lackluster performance, with its shares losing 3.3% in the past three months compared with the Zacks Consumer Products – Staples industry’s decline of 2.1%. The PG stock has also underperformed the broader Zacks Consumer Staples sector and the S&P 500's growth of 2.3% and 7.1%, respectively, in the same period.
PG’s performance is notably weaker than that of its competitors, Unilever PLC UL, Colgate-Palmolive Company CL and Grocery Outlet Holding Corp. GO, which have rallied 6.9%, 1.2% and 11.2%, respectively, in the past three months.
At its current price, Procter & Gamble’s stock trades 9.7% below its 52-week high mark of $180.43 and 4% above its 52-week low of $156.58.
The recent price action follows the company’s soft sales performance in third-quarter fiscal 2025 and management’s cautious near-term outlook based on the ongoing market conditions, including a volatile consumer and geopolitical landscape. PG reported a mixed performance in the third quarter of fiscal 2025, highlighted by a 2% decline in sales and a modest 1% growth in earnings per share (EPS). The top-line decline was primarily led by weak performances in the Baby, Feminine & Family Care, and Fabric & Home Care segments due to lower volumes and unfavorable currency impacts.
PG has revised its fiscal 2025 guidance downward, reflecting a more cautious outlook amid ongoing cost pressures. The company expects total sales to be flat year over year, with organic sales growth trimmed to 2%, down from the previously stated 2-4% and 3-5%, respectively. The revision signals slower-than-anticipated top-line momentum as macroeconomic headwinds and softer volume trends weigh on performance.
On the earnings side, Procter & Gamble projects EPS to grow 6-8% from last year’s reported figure of $6.02, while core EPS is estimated to be $6.72-$6.82, indicating 2-4% growth versus the $6.59 reported in fiscal 2024. These figures fall short of the company’s earlier guidance of 10-12% GAAP EPS growth and 5-7% growth in core EPS. Profitability remains under pressure from a $400-million after-tax drag tied to commodity costs and unfavorable currency exchange, along with slight impacts from interest expenses. Despite these challenges, PG expects its core tax rate to hold steady year over year.
The Zacks Consensus Estimate for PG’s fiscal 2025 EPS was unchanged in the last 30 days, while the same for the fiscal 2026 EPS moved up 0.3%.

For fiscal 2025, the Zacks Consensus Estimate for Procter & Gamble’s revenues and EPS implies year-over-year growth of 0.2% and 2.9%, respectively. For fiscal 2026, the consensus mark for revenues and EPS indicates 2.8% and 3.4% year-over-year growth, respectively. (Find the latest EPS estimates and surprises on Zacks Earnings Calendar.)
So, is it the right time to stock up on shares, or should you book profits? Let us delve deeper into the company’s fundamentals.
Procter & Gamble’s enduring success stems from its ability to evolve with changing consumer expectations, backed by a long-term strategy built on innovation, sustainability and operational discipline. The company’s focus on category leadership and market expansion, anchored by a portfolio of essential, high-performance products, has helped drive consistent momentum across geographies. Even in the face of macroeconomic challenges, Procter & Gamble’s strong brand equity and execution capabilities continue to support its positioning as a global consumer goods leader.
To mitigate rising input costs and protect margins, PG is executing a comprehensive productivity strategy centered around multi-year savings plans. Initiatives like “Supply Chains 3.0” aim to modernize operations and unlock efficiencies, targeting up to $1.5 billion in gross savings. The company is leveraging digital tools, smarter logistics and collaborative retail partnerships to extract $200-$300 million in additional savings through improved sourcing, fill-rate optimization and marketing effectiveness. By balancing cost discipline with strategic reinvestment, Procter & Gamble is reinforcing its resilience and long-term growth outlook, even as near-term headwinds pressure its revised fiscal 2025 guidance.
PG undoubtedly commands a high valuation, reflecting its strong market positioning, brand power and long-term growth potential compared with its peers. However, we believe that its valuation is too stretched at this time.
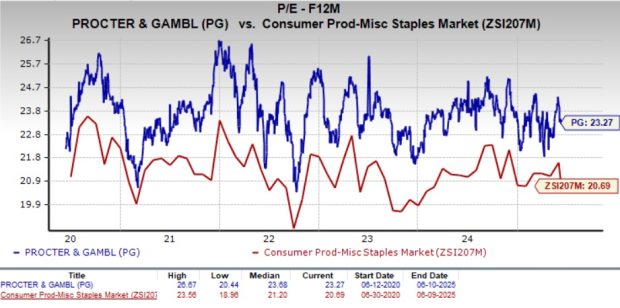
Procter & Gamble trades at a significant premium to industry peers with a forward 12-month price-to-earnings (P/E) multiple of 23.27X. The current valuation is below its five-year high of 26.67X and ahead of the broader industry’s multiple of 20.69X.
At 23.27X P/E, PG is trading at a valuation much higher than its competitors. Its competitors, such as Unilever and Grocery Outlet, are trading at lower multiples. Unilever and Grocery Outlet have forward 12-month P/E ratios of 18.62X and 21.18X — all significantly higher than Procter & Gamble. However, PG trades at a discount to Colgate’s P/E multiple of 24.4X.
Despite Procter & Gamble’s robust brand portfolio and long-term strategic resilience, recent technical indicators and valuation suggest a more cautious near-term stance for investors. The stock’s decline below its 50-day and 200-day SMAs reflects a growing bearish sentiment, aligning with its share price decline in the past three months.
Coupled with a softer sales outlook, operational headwinds and muted estimate revisions, this downward trend indicates that investors may be reassessing the near-term upside potential of the stock. While P&G’s fundamentals remain strong, its recent price action underscores waning momentum in the face of cost inflation, currency pressure and segment-level volume declines.
Adding to the caution, PG trades at a premium relative to its peers, leaving limited room for upside, especially in a volatile macro environment wherein investors increasingly favor companies with more compelling growth stories and leaner multiples.
Until there is clearer evidence of margin recovery, volume stabilization, or upward estimate revisions, the prudent approach may be to stay on the sidelines and monitor how the company navigates its near-term challenges. PG currently has a Zacks Rank #4 (Sell).
You can see the complete list of today’s Zacks #1 Rank (Strong Buy) stocks here.
Want the latest recommendations from Zacks Investment Research? Today, you can download 7 Best Stocks for the Next 30 Days. Click to get this free report
This article originally published on Zacks Investment Research (zacks.com).
| 2 hours | |
| 3 hours | |
| 5 hours | |
| 5 hours | |
| 7 hours | |
| 7 hours | |
| 8 hours | |
| 8 hours | |
| 9 hours | |
| 10 hours | |
| 11 hours | |
| 14 hours | |
| Mar-09 | |
| Mar-09 | |
| Mar-09 |
Join thousands of traders who make more informed decisions with our premium features. Real-time quotes, advanced visualizations, backtesting, and much more.
Learn more about Finviz Elite