|
|
|

|
|||||
|
|
|
New Feature: See Wall Street analyst ratings directly on Finviz charts for deeper context into price action.
Favorable quarterly reports from most of the large domestic banks are drawing attention to the financial sector, and Interactive Brokers IBKR is worthy of consideration ahead of its Q2 results on Thursday, July 17.
Soaring nearly +100% in the last year, Interactive Brokers stock is up +35% year to date and looks poised for higher highs after hitting a 52-week peak of $60 a share in today’s trading session.
The automated global electronic broker is seeing supercharged trading volumes following an unprecedented rebound among the U.S. stock exchanges. Enhancing its product offerings, Interactive Brokers has recently launched IBKR InvestMentor, a microlearning app aimed at educating new investors and has expanded its ETF and cryptocurrency offerings to compete with competitors such as Charles Schwab SCHW and Robinhood Markets HOOD.
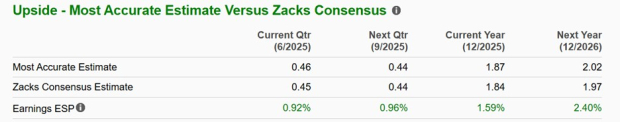
Based on Zacks' estimates, Interactive Brokers' Q2 sales are expected to increase 8% to $1.34 billion compared to $1.23 billion a year ago. On the bottom line, Q2 EPS projections of $0.45 would be a slight increase from $0.44 a share in the prior year quarter.
Furthermore, the Zacks ESP (Expected Surprise Prediction) indicates Interactive Brokers could surpass earnings expectations with the Most Accurate and recent estimates among Wall Street having Q2 EPS slated at $0.46 (Current Qtr below).
Most intriguing and alluding to the plausibility of more upside in IBKR is that earnings estimate revisions for Interactive Brokers have continued to trend higher following the announcement of its upgraded product offerings and investment tools. In the last week, fiscal 2025 and FY26 EPS estimates are up 4% and 3% respectively.

Interactive Brokers' annual earnings are now expected to rise 4% this year and are projected to increase another 7% in FY26 to $1.97 per share. Reassuringly, this is accompanied by projections of steady sales growth with Interactive Brokers’ top line expected to expand 3% in FY25 and forecasted to stretch another 6% next year to $5.73 billion.

While the excitement for Interactive Brokers and Robinhood’s innovative trading platforms has led to blazing performances for both of their stocks, it’s noteworthy that IBKR still trades at a reasonable 32.4X forward earnings multiple compared to HOOD at 79.6X.
In comparison, Interactive Brokers trades closer to their Zacks Financial-Investment Bank Industry average of 15.8X and Charles Schwab’s 21.9X.

Investors looking for exposure to the growth that many FinTech firms offer have a more affordable option with Interactive Brokers as opposed to Robinhood Markets. Appearing to be poised for higher highs ahead of its Q2 report, IBKR currently sports a Zacks Rank #1 (Strong Buy) and notably has an “A” Zacks Style Scores grade for Momentum.
Want the latest recommendations from Zacks Investment Research? Today, you can download 7 Best Stocks for the Next 30 Days. Click to get this free report
This article originally published on Zacks Investment Research (zacks.com).
| 13 min | |
| 1 hour |
Why Robinhood And Bloom Energy Show The Perils Of Investor Preconceptions
HOOD
Investor's Business Daily
|
| 4 hours | |
| 5 hours | |
| 5 hours | |
| 6 hours | |
| 6 hours | |
| 8 hours | |
| 8 hours | |
| 8 hours | |
| 8 hours | |
| 15 hours | |
| 15 hours | |
| Feb-18 | |
| Feb-18 |
Join thousands of traders who make more informed decisions with our premium features. Real-time quotes, advanced visualizations, backtesting, and much more.
Learn more about FINVIZ*Elite