|
|
|

|
|||||
|
|
|
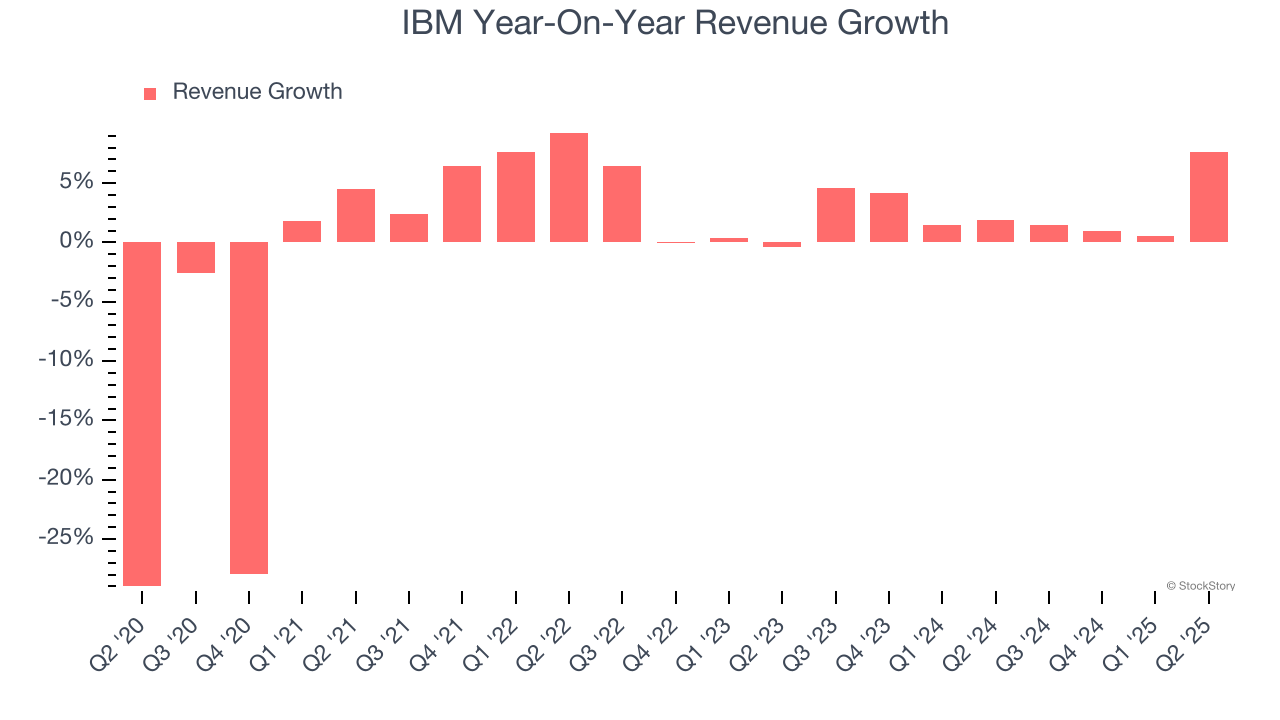
Technology and consulting giant IBM (NYSE:IBM) reported Q2 CY2025 results exceeding the market’s revenue expectations, with sales up 7.7% year on year to $16.98 billion. On the other hand, next quarter’s revenue guidance of $15.72 billion was less impressive, coming in 2.3% below analysts’ estimates. Its non-GAAP profit of $2.80 per share was 5.5% above analysts’ consensus estimates.
Is now the time to buy IBM? Find out by accessing our full research report, it’s free.
"We once again exceeded expectations for revenue, profit and free cash flow in the quarter. IBM remains highly differentiated in the market because of our deep innovation and domain expertise, both crucial in helping clients deploy and scale AI. Our generative AI book of business continues to accelerate and now stands at more than $7.5 billion," said Arvind Krishna, IBM chairman, president and chief executive officer.
With a corporate history spanning over a century and once known for its iconic mainframe computers, IBM (NYSE:IBM) provides hybrid cloud computing platforms, AI solutions, consulting services, and enterprise infrastructure to help businesses modernize their operations.
A company’s long-term sales performance can indicate its overall quality. Any business can put up a good quarter or two, but the best consistently grow over the long haul.
With $64.04 billion in revenue over the past 12 months, IBM is a behemoth in the business services sector and benefits from economies of scale, giving it an edge in distribution. This also enables it to gain more leverage on its fixed costs than smaller competitors and the flexibility to offer lower prices. However, its scale is a double-edged sword because it’s harder to find incremental growth when you’ve penetrated most of the market. For IBM to boost its sales, it likely needs to adjust its prices, launch new offerings, or lean into foreign markets.
As you can see below, IBM struggled to increase demand as its $64.04 billion of sales for the trailing 12 months was close to its revenue five years ago. This shows demand was soft, a poor baseline for our analysis.
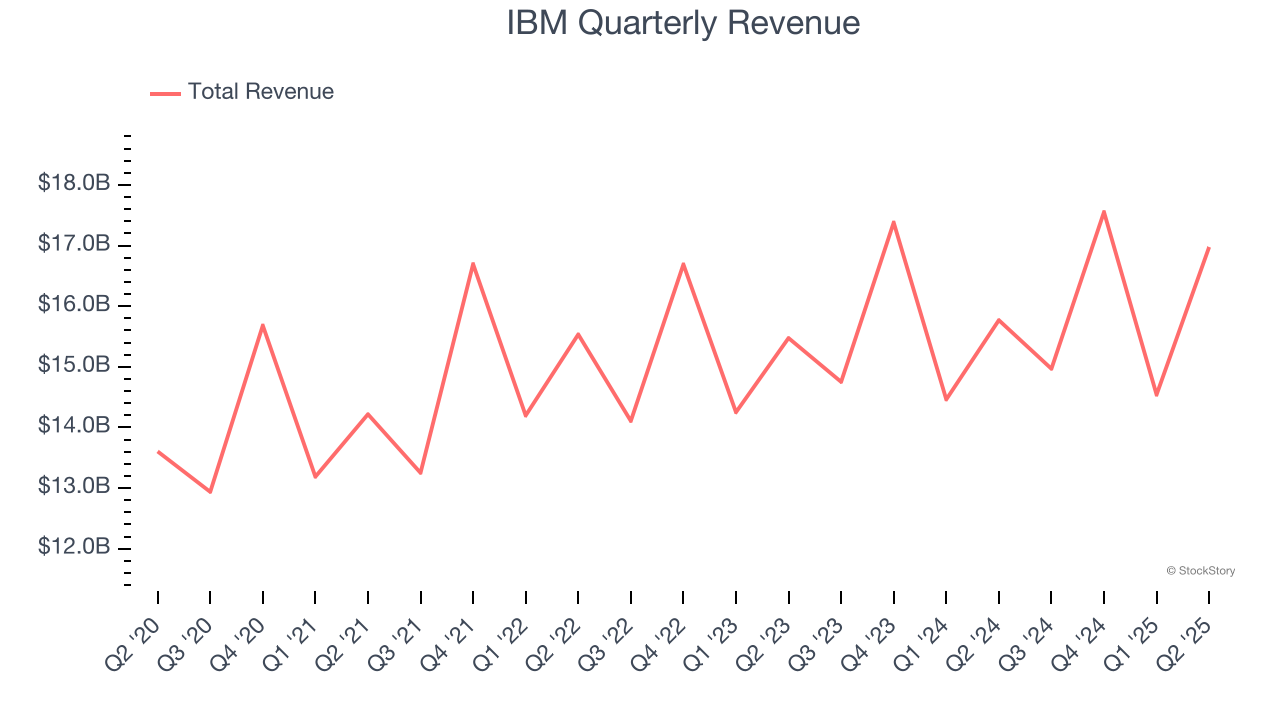
Long-term growth is the most important, but within business services, a half-decade historical view may miss new innovations or demand cycles. IBM’s annualized revenue growth of 2.9% over the last two years is above its five-year trend, but we were still disappointed by the results.
We can better understand the company’s revenue dynamics by analyzing its most important segment, Software. Over the last two years, IBM’s Software revenue averaged 7.8% year-on-year growth. This segment has outperformed its total sales during the same period, lifting the company’s performance.
This quarter, IBM reported year-on-year revenue growth of 7.7%, and its $16.98 billion of revenue exceeded Wall Street’s estimates by 2.4%. Company management is currently guiding for a 5% year-on-year increase in sales next quarter.
Looking further ahead, sell-side analysts expect revenue to grow 6% over the next 12 months, an improvement versus the last two years. This projection is above the sector average and implies its newer products and services will catalyze better top-line performance.
Software is eating the world and there is virtually no industry left that has been untouched by it. That drives increasing demand for tools helping software developers do their jobs, whether it be monitoring critical cloud infrastructure, integrating audio and video functionality, or ensuring smooth content streaming. Click here to access a free report on our 3 favorite stocks to play this generational megatrend.
Operating margin is an important measure of profitability as it shows the portion of revenue left after accounting for all core expenses – everything from the cost of goods sold to advertising and wages. It’s also useful for comparing profitability across companies with different levels of debt and tax rates because it excludes interest and taxes.
IBM has managed its cost base well over the last five years. It demonstrated solid profitability for a business services business, producing an average operating margin of 13.4%.
Analyzing the trend in its profitability, IBM’s operating margin rose by 4.9 percentage points over the last five years, showing its efficiency has improved.
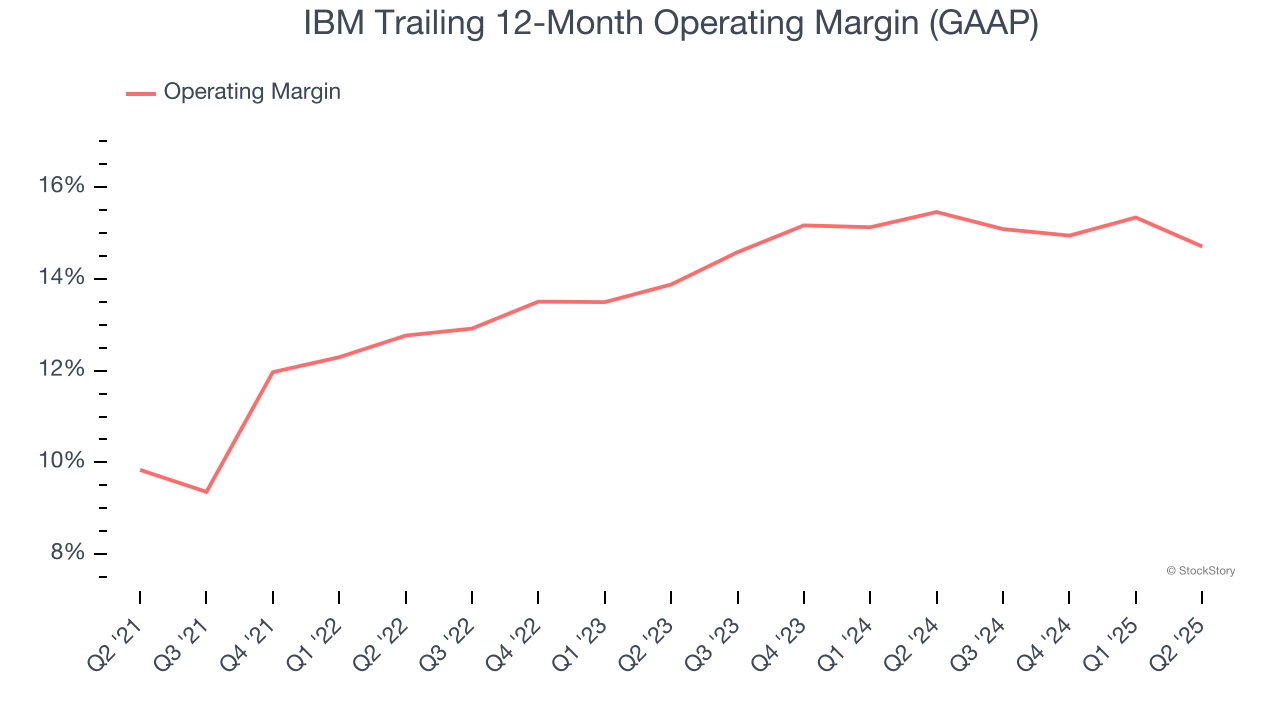
In Q2, IBM generated an operating margin profit margin of 12.9%, down 2.4 percentage points year on year. This contraction shows it was less efficient because its expenses grew faster than its revenue.
We track the long-term change in earnings per share (EPS) for the same reason as long-term revenue growth. Compared to revenue, however, EPS highlights whether a company’s growth is profitable.
IBM’s EPS grew at a weak 3.3% compounded annual growth rate over the last five years. On the bright side, this performance was better than its flat revenue and tells us management responded to softer demand by adapting its cost structure.
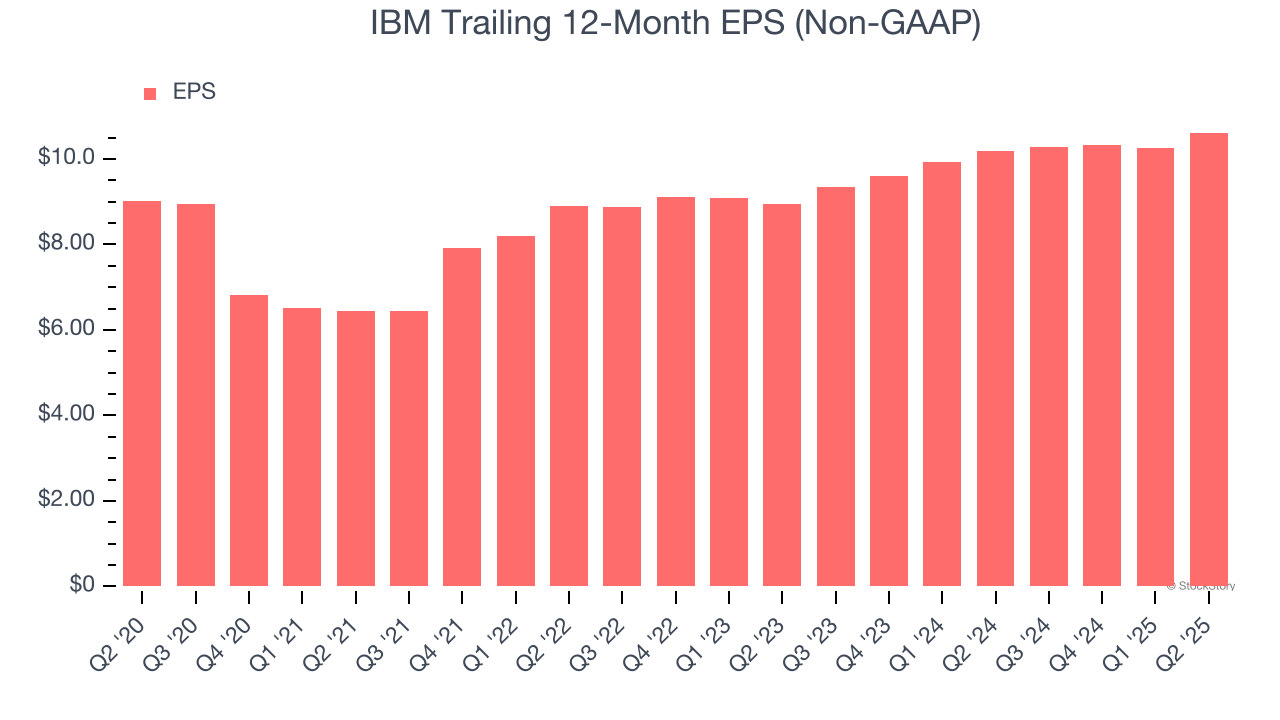
Diving into the nuances of IBM’s earnings can give us a better understanding of its performance. As we mentioned earlier, IBM’s operating margin declined this quarter but expanded by 4.9 percentage points over the last five years. This was the most relevant factor (aside from the revenue impact) behind its higher earnings; interest expenses and taxes can also affect EPS but don’t tell us as much about a company’s fundamentals.
Like with revenue, we analyze EPS over a more recent period because it can provide insight into an emerging theme or development for the business.
For IBM, its two-year annual EPS growth of 8.9% was higher than its five-year trend. Accelerating earnings growth is almost always an encouraging data point.
In Q2, IBM reported EPS at $2.80, up from $2.43 in the same quarter last year. This print beat analysts’ estimates by 5.5%. Over the next 12 months, Wall Street expects IBM’s full-year EPS of $10.62 to grow 6.7%.
It was encouraging to see IBM beat analysts’ revenue expectations this quarter. We were also happy its EPS outperformed Wall Street’s estimates. On the other hand, its operating income missed and its revenue guidance for next quarter fell short of Wall Street’s estimates. Overall, this was a mixed quarter. The stock traded down 5.5% to $266.63 immediately after reporting.
IBM’s earnings report left more to be desired. Let’s look forward to see if this quarter has created an opportunity to buy the stock. The latest quarter does matter, but not nearly as much as longer-term fundamentals and valuation, when deciding if the stock is a buy. We cover that in our actionable full research report which you can read here, it’s free.
| 5 min | |
| Jul-01 | |
| Jul-01 | |
| Jul-01 | |
| Jul-01 | |
| Jun-30 | |
| Jun-30 | |
| Jun-30 | |
| Jun-30 | |
| Jun-30 | |
| Jun-30 | |
| Jun-29 | |
| Jun-29 | |
| Jun-29 | |
| Jun-28 |
Join thousands of traders who make more informed decisions with our premium features. Real-time quotes, advanced visualizations, alerts, and much more.
Learn more about Finviz Elite