|
|
|

|
|||||
|
|
|
Sensata Technologies Holding plc ST reported second-quarter 2025 adjusted earnings per share (EPS) of 87 cents compared with 92 cents a year ago. However, the bottom line topped the Zacks Consensus Estimate by 3.6%.
Revenues for the quarter reached $943.4 million, down 8.9% from a year ago. The top-line contraction was attributable to earlier announced divestitures and product lifecycle optimization efforts. However, the figure outperformed management’s expectations ($910-$940 million) and beat the consensus estimate by 1.1%. Strength in Sensing Solutions cushioned the top-line performance.
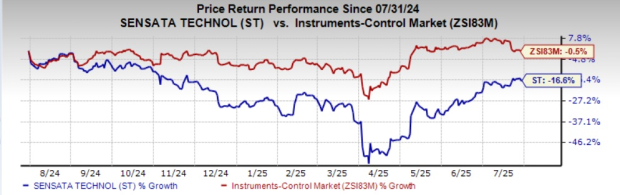
Following the announcement, shares of ST lost around 3% in the after-market trading session yesterday. In the past year, shares have lost 16.6% compared with the Instruments-Control industry’s decline of 0.5%.
Performance Sensing revenues (69.1% of total revenues) decreased 9.9% year over year to $652.2 million. The top line was affected by divested products and reduced on-road truck production in North America and Europe.
Segmental adjusted operating income was $146.9 million compared with $161.4 million in the prior-year quarter.
Sensing Solutions’ revenues (30.9%) were $291.2 million, up 8.6% year over year. This was the second consecutive quarter of year-over-year growth, fueled by new content additions in its industrials segment and market outperformance in aerospace.
Segmental adjusted operating income was $88 million compared with $79.7 million in the prior-year quarter.
Adjusted operating income was $179.1 million compared with $196.7 million in the year-ago quarter. Adjusted operating margin expanded 20 basis points to 19%.
Adjusted EBITDA totaled $212.1 million in the quarter, declining from $231.7 million in the previous-year quarter.
Total operating expenses were $805.3 million, down 11.1% year over year.
In the quarter under discussion, Sensata generated $140.9 million of net cash from operating activities compared with $143.5 million in the prior-year quarter. Free cash flow was $115.5 million compared with $98.4 million a year ago.
As of June 30, 2025, the company had $661.8 million in cash and cash equivalents and $3,178.5 million of net long-term debt compared with $588.1 million and $3,177.3 million, respectively, as of March 31, 2025.

Sensata Technologies Holding N.V. price-consensus-eps-surprise-chart | Sensata Technologies Holding N.V. Quote
In the second quarter of 2025, Sensata returned approximately $37.7 million to shareholders, comprising $20.1 million in share repurchases and $17.6 million in quarterly dividends.
Earlier this month, the company declared a third-quarter dividend of 12 cents per share, payable on Aug. 27, 2025, to shareholders of record as of Aug. 13, 2025.
For the third quarter, the company projects revenues in the band of $900-$930 million, indicating a decrease of 5% to 1%, sequentially. This includes approximately $15 million related to tariff-related costs corresponding to pass-through revenues.
Adjusted operating income is expected to be $171-$179 million, implying a decline of 5% to no change, sequentially.
On a sequential basis, adjusted EPS is estimated to be 81-87 cents, suggesting no change to a decrease of 7%. Adjusted net income is anticipated in the $119-$127 million range, indicating stable performance to a decline of 7%.
Sensata currently carries a Zacks Rank #2 (Buy). You can see the complete list of today’s Zacks #1 Rank (Strong Buy) stocks here.
Badger Meter, Inc. BMI reported earnings per share of $1.17 for second-quarter 2025, which missed the Zacks Consensus Estimate by 3.3%. However, the bottom line compared favorably with the year-ago quarter’s EPS of $1.12.
Quarterly net sales were $238.1 million, up 10% from $216.7 million in the year-ago quarter, driven by higher utility water sales and the contribution from the SmartCover acquisition. The Zacks Consensus Estimate was pegged at $234.3 million.
In the past, shares of BMI have lost 8.8%.
Simulations Plus, Inc. SLP reported third-quarter fiscal 2025 adjusted earnings of 45 cents per share, which expanded 66.7% year over year. The figure also surpassed the Zacks Consensus Estimate of 26 cents per share.
Quarterly revenues jumped 10% year over year to $20.4 million, driven by continued momentum across its software and services business segments, along with a $2.4 million boost from the Pro-ficiency acquisition.
In the past, shares of SLP have declined 67%
SAP SE SAP reported second-quarter 2025 non-IFRS earnings of €1.50 ($1.70) per share, climbing 37% from the year-ago quarter’s levels. The Zacks Consensus Estimate was pegged at $1.63.
Driven by robust cloud growth, disciplined cost control, and expanding AI capabilities, SAP reported total revenues on a non-IFRS basis of €9.03 billion ($10.24 billion), representing a 9% year-over-year increase (up 12% at constant currency or cc). The Zacks Consensus estimate was pegged at $10.37 billion.
Shares of SAP have surged 35.9% in the past year.
Want the latest recommendations from Zacks Investment Research? Today, you can download 7 Best Stocks for the Next 30 Days. Click to get this free report
This article originally published on Zacks Investment Research (zacks.com).
| Jul-31 | |
| Jul-31 | |
| Jul-30 | |
| Jul-29 | |
| Jul-29 | |
| Jul-29 | |
| Jul-27 | |
| Jul-27 | |
| Jul-24 | |
| Jul-24 | |
| Jul-24 | |
| Jul-24 | |
| Jul-24 | |
| Jul-24 | |
| Jul-24 |
Join thousands of traders who make more informed decisions with our premium features. Real-time quotes, advanced visualizations, alerts, and much more.
Learn more about Finviz Elite