|
|
|

|
|||||
|
|
|
Between Oct. 1, 2022 and June 30, 2025, Warren Buffett has overseen more than $177 billion in net stock sales.
Though Berkshire Hathaway's billionaire chief would never bet against America, he's having a difficult time finding value in a historically pricey stock market.
Patience plays a big role in Warren Buffett's investment strategy -- and his shareholders have reaped the rewards of this approach for decades.
In May, Wall Street's most-followed money manager, Berkshire Hathaway's (NYSE: BRK.A)(NYSE: BRK.B) CEO Warren Buffett, made waves by announcing his intent to retire from the role of CEO by the end of the year. While not unexpected -- Buffett will turn 95 on Aug. 30 -- it nevertheless raises eyebrows given the Oracle of Omaha's outstanding investment track record, where he's overseen a cumulative return of nearly 5,750,000% in his company's Class A shares (BRK.A) spanning six decades.
However, Buffett's pending retirement from day-to-day operations is, arguably, not the biggest story right now at Berkshire Hathaway.
Where to invest $1,000 right now? Our analyst team just revealed what they believe are the 10 best stocks to buy right now. Learn More »
On Saturday, Aug. 2, Berkshire lifted the hood on its second-quarter operating results. While the report undeniably cautioned investors that U.S. tariffs would impact its operations (presumably in a bad way), Berkshire Hathaway's consolidated cash flow statement was the most important piece of information.
Though investors look to Warren Buffett for his ability to spot amazing deals hiding in plain sight, with some aiming to mirror his buying activity, the hard truth is that Berkshire's billionaire chief has been a net seller of stocks for 11 consecutive quarters.
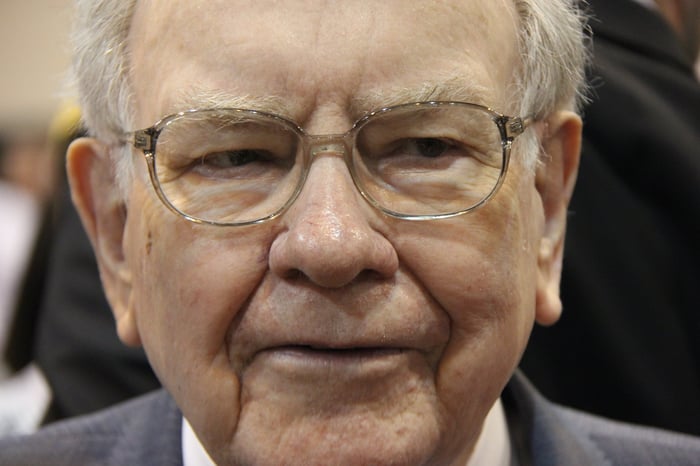
Berkshire Hathaway CEO Warren Buffett. Image source: The Motley Fool.
In less than two weeks, following the close of trading on Aug. 14, Berkshire Hathaway will file Form 13F with the Securities and Exchange Commission. This is a required quarterly filing for institutional investors with at least $100 million in assets under management that allows investors to see which stocks Wall Street's smartest money managers have been buying and selling.
Even though we don't yet know all of the stocks Buffett and his top advisors, Todd Combs and Ted Weschler, were buying and selling during the June-ended quarter, Berkshire's cash flow statement paints a very clear picture of how Buffett and his team approached their buying and selling activity.
On page 6 of Berkshire's quarterly operating results, under "Cash flows from investing activities," you'll find the two most important line items of interest: "purchases of equity securities" and "sales of equity securities."
During the second quarter, $3.909 billion was spent buying stocks, which is actually an uptick from the $3.183 billion spent buying stocks in the March-ended quarter. However, $6.915 billion, in aggregate, was sold, which is also higher than the $4.677 billion sold in the first quarter. On a net basis, Buffett oversaw $3.006 billion more in stock sales than purchases.
Over the past 11 quarters (33 months), Warren Buffett has overseen:
Altogether, Buffett has sold $177.431 billion more in stocks than he's purchased since Oct. 1, 2022 -- and it represents an unmistakable and deafening warning to Wall Street.
Lengthy books have been written about Warren Buffett's investment philosophy and his laundry list of unwritten rules. But only two of these rules are unbreakable:
Keeping the first rule in mind (i.e., he's never going to short-sell stocks or buy put options against Wall Street's major stock indexes), the issue facilitating the Oracle of Omaha's 11-quarter stock-selling streak is that value has become almost impossible to find in the market.
For example, the market-cap-to-GDP ratio, which has affably come to be known as the "Buffett Indicator," hit an all-time high a little over one week ago. This ratio, which adds up the value of all publicly traded companies and divides that amount by U.S. gross domestic product (GDP), has historically averaged 85%, when back-tested to 1970. But in late July, it topped 210%!
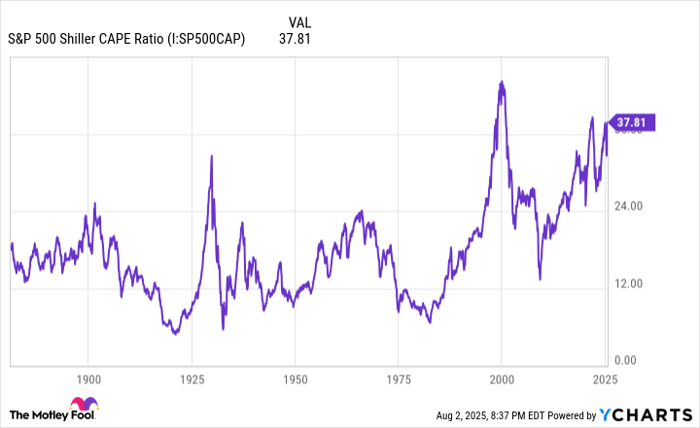
S&P 500 Shiller CAPE Ratio data by YCharts.
It's a similar story for the S&P 500's (SNPINDEX: ^GSPC) Shiller price-to-earnings (P/E) Ratio, which is also known as the cyclically adjusted P/E Ratio, or CAPE Ratio. Unlike the traditional P/E ratio, which divides a company's share price by its trailing-12-month earnings, the Shiller P/E is based on average inflation-adjusted earnings over 10 years. Accounting for a decade of earnings history, as opposed to just 12 months, ensures that shock events and economic downturns can't skew the results.
The S&P 500's Shiller P/E Ratio has been back-tested to January 1871 and sports an average multiple of 17.26. In late July, this multiple hit a closing value of 38.97, which made this the third-priciest continuous bull market in history.
For some added context, the previous five instances where the Shiller P/E topped and sustained 30 were eventually followed by declines in the benchmark S&P 500 of at least 20%, if not substantially higher.
Despite Warren Buffett having a near-record amount of cash at his disposal, there's simply no incentive for he or his team to aggressively deploy this capital given how historically pricey the stock market is at the moment.

Image source: Getty Images.
For some investors, the Oracle of Omaha's willingness to sit on his hands and allow Berkshire Hathaway's cash pile to grow to more than $344 billion is unnerving. Historically, Buffett's greatest wealth-creating moments have come from investing his company' capital or making game-changing acquisitions.
But make no mistake about it -- patience is built into Buffett's investment strategy, and it's paid off handsomely for his shareholders spanning six decades.
No matter how amazing a company's management team or capital-return program happens to be, Berkshire's chief is going to stand pat if he doesn't believe he's getting a good deal. Waiting on price dislocations to materialize has been something of a calling card of success for Buffett during his tenure as CEO.
Arguably one of the top examples of Berkshire's soon-to-be-retiring chief pouncing on a phenomenal deal hiding in plain sight is his $5 billion purchase of Bank of America (NYSE: BAC) preferred stock in August 2011. Though Bank of America wasn't thirsty for capital at the time, it was still working its way back from the depths of the financial crisis. Berkshire was able to infuse one of America's largest banks by assets with $5 billion in capital in exchange for preferred BofA stock.
However, the crown jewel of this transaction was the warrants Berkshire received that allowed Buffett to pull the trigger on up to 700 million common shares of Bank of America stock at a $7.14 exercise price. When the entirety of these warrants was exercised in mid-2017, Berkshire enjoyed an instant windfall of $12 billion.
Price dislocations in amazing businesses don't occur on a daily basis, and they're even scarcer when the stock market is historically pricey. While Buffett successor Greg Abel may be the one that eventually deploys Berkshire's treasure chest, understand that being patient is part of the plan and a key ingredient to Berkshire Hathaway's long-term success.
Before you buy stock in Berkshire Hathaway, consider this:
The Motley Fool Stock Advisor analyst team just identified what they believe are the 10 best stocks for investors to buy now… and Berkshire Hathaway wasn’t one of them. The 10 stocks that made the cut could produce monster returns in the coming years.
Consider when Netflix made this list on December 17, 2004... if you invested $1,000 at the time of our recommendation, you’d have $624,823!* Or when Nvidia made this list on April 15, 2005... if you invested $1,000 at the time of our recommendation, you’d have $1,064,820!*
Now, it’s worth noting Stock Advisor’s total average return is 1,019% — a market-crushing outperformance compared to 178% for the S&P 500. Don’t miss out on the latest top 10 list, available when you join Stock Advisor.
*Stock Advisor returns as of July 29, 2025
Bank of America is an advertising partner of Motley Fool Money. Sean Williams has positions in Bank of America. The Motley Fool has positions in and recommends Berkshire Hathaway. The Motley Fool has a disclosure policy.
| Feb-23 | |
| Feb-23 | |
| Feb-23 | |
| Feb-23 | |
| Feb-23 | |
| Feb-23 | |
| Feb-23 | |
| Feb-22 | |
| Feb-22 | |
| Feb-22 | |
| Feb-21 | |
| Feb-20 | |
| Feb-20 | |
| Feb-20 | |
| Feb-20 |
Join thousands of traders who make more informed decisions with our premium features. Real-time quotes, advanced visualizations, backtesting, and much more.
Learn more about FINVIZ*Elite