|
|
|

|
|||||
|
|
|

Automotive services company Driven Brands (NASDAQ:DRVN) announced better-than-expected revenue in Q2 CY2025, but sales fell by 9.9% year on year to $551 million. The company expects the full year’s revenue to be around $2.1 billion, close to analysts’ estimates. Its non-GAAP profit of $0.36 per share was 7.2% above analysts’ consensus estimates.
Is now the time to buy Driven Brands? Find out by accessing our full research report, it’s free.
“In the second quarter, we delivered another strong performance, with consistent results across same store sales, revenue, adjusted EBITDA, and adjusted earnings per share. We continued our disciplined debt reduction strategy and achieved pro forma net leverage of 3.9x following the sale of the U.S. car wash seller note in July. These results demonstrate the power of our diversified platform and our growth and cash playbook. Take 5 Oil Change remains at the forefront through industry-leading growth, achieving its 20th consecutive quarter of same store sales growth. I'm proud of how our team and franchise partners continue to execute with focus and discipline in this dynamic macro environment,” said Danny Rivera, President and Chief Executive Officer.
With approximately 5,000 locations across 49 U.S. states and 13 other countries, Driven Brands (NASDAQ:DRVN) operates a network of automotive service centers offering maintenance, car washes, paint, collision repair, and glass services across North America.
A company’s long-term performance is an indicator of its overall quality. Any business can put up a good quarter or two, but many enduring ones grow for years.
With $2.22 billion in revenue over the past 12 months, Driven Brands is a mid-sized business services company, which sometimes brings disadvantages compared to larger competitors benefiting from better economies of scale. On the bright side, it can still flex high growth rates because it’s working from a smaller revenue base.
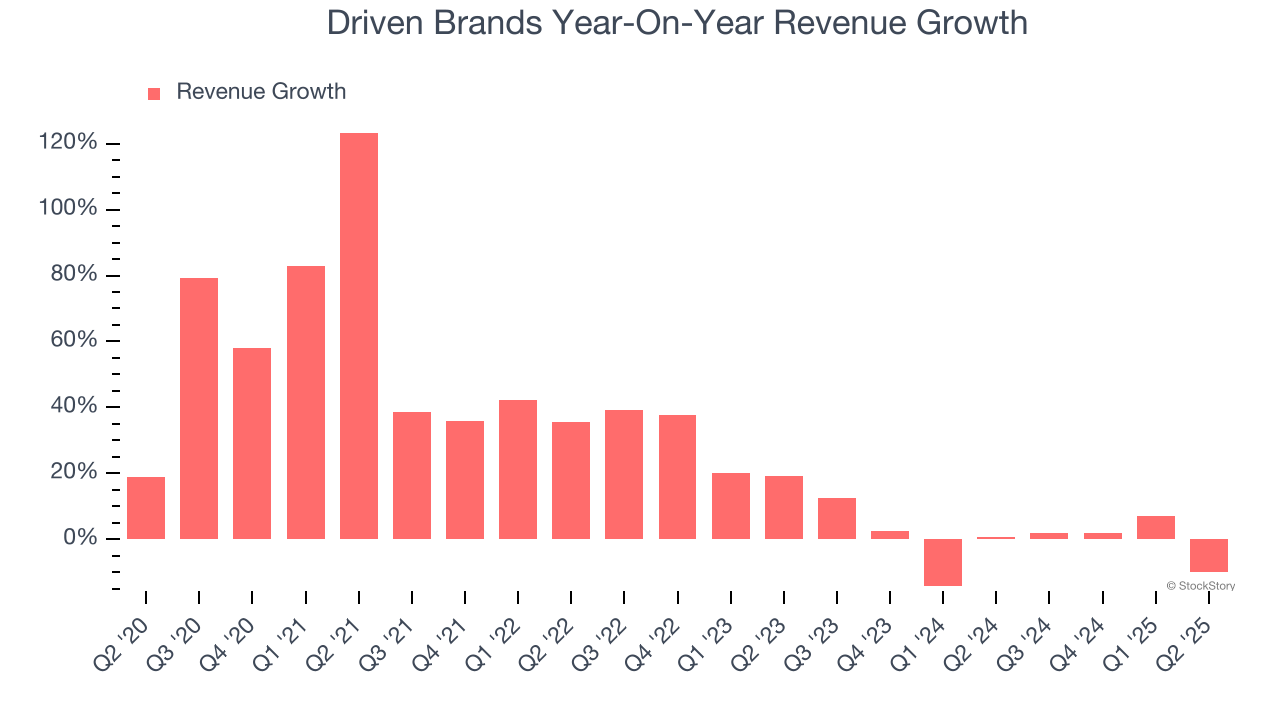
As you can see below, Driven Brands’s sales grew at an incredible 26.7% compounded annual growth rate over the last five years. This shows it had high demand, a useful starting point for our analysis.
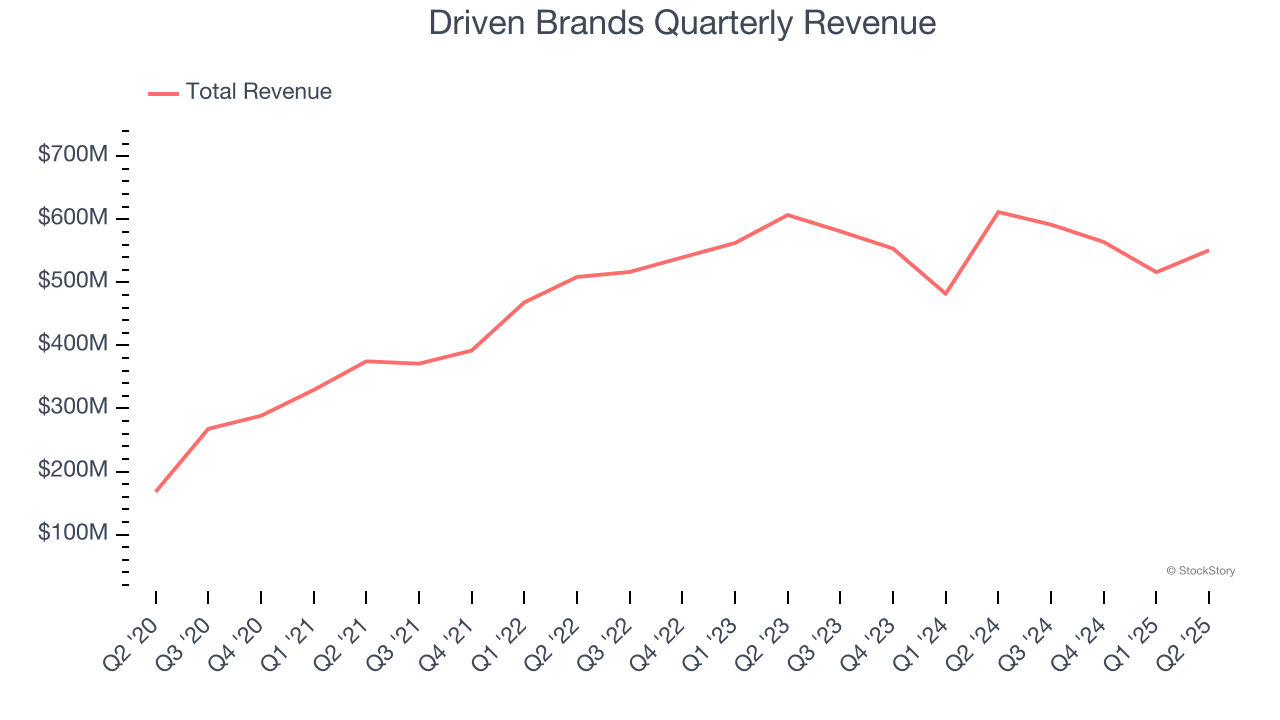
We at StockStory place the most emphasis on long-term growth, but within business services, a half-decade historical view may miss recent innovations or disruptive industry trends. Driven Brands’s recent performance shows its demand has slowed significantly as its revenue was flat over the last two years.
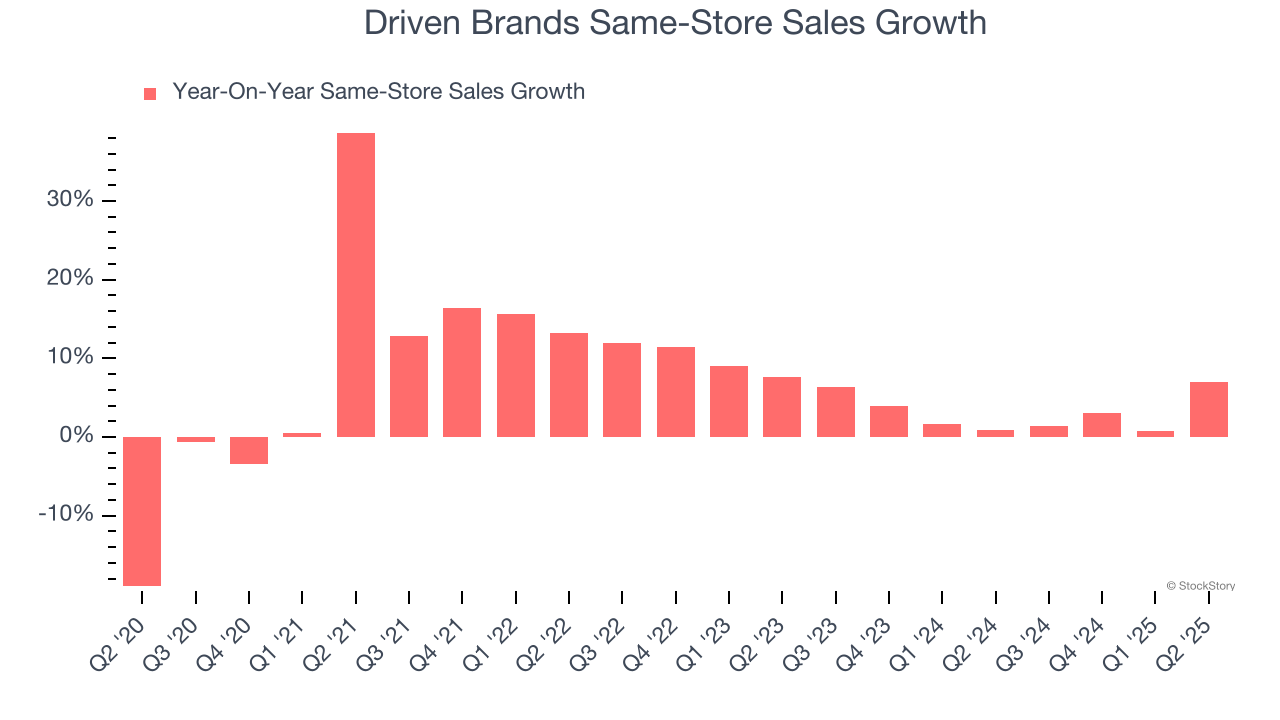
We can better understand the company’s revenue dynamics by analyzing its same-store sales, which show how much revenue its established locations generate. Over the last two years, Driven Brands’s same-store sales averaged 3.1% year-on-year growth. Because this number is better than its revenue growth, we can see its sales from existing locations are performing better than its sales from new locations.
This quarter, Driven Brands’s revenue fell by 9.9% year on year to $551 million but beat Wall Street’s estimates by 1.9%.
Looking ahead, sell-side analysts expect revenue to remain flat over the next 12 months. This projection is underwhelming and implies its newer products and services will not catalyze better top-line performance yet.
Software is eating the world and there is virtually no industry left that has been untouched by it. That drives increasing demand for tools helping software developers do their jobs, whether it be monitoring critical cloud infrastructure, integrating audio and video functionality, or ensuring smooth content streaming. Click here to access a free report on our 3 favorite stocks to play this generational megatrend.
Although Driven Brands was profitable this quarter from an operational perspective, it’s generally struggled over a longer time period. Its expensive cost structure has contributed to an average operating margin of negative 3% over the last five years. Unprofitable business services companies require extra attention because they could get caught swimming naked when the tide goes out. It’s hard to trust that the business can endure a full cycle.
Analyzing the trend in its profitability, Driven Brands’s operating margin decreased by 21.7 percentage points over the last five years. This raises questions about the company’s expense base because its revenue growth should have given it leverage on its fixed costs, resulting in better economies of scale and profitability. Driven Brands’s performance was poor no matter how you look at it - it shows that costs were rising and it couldn’t pass them onto its customers.
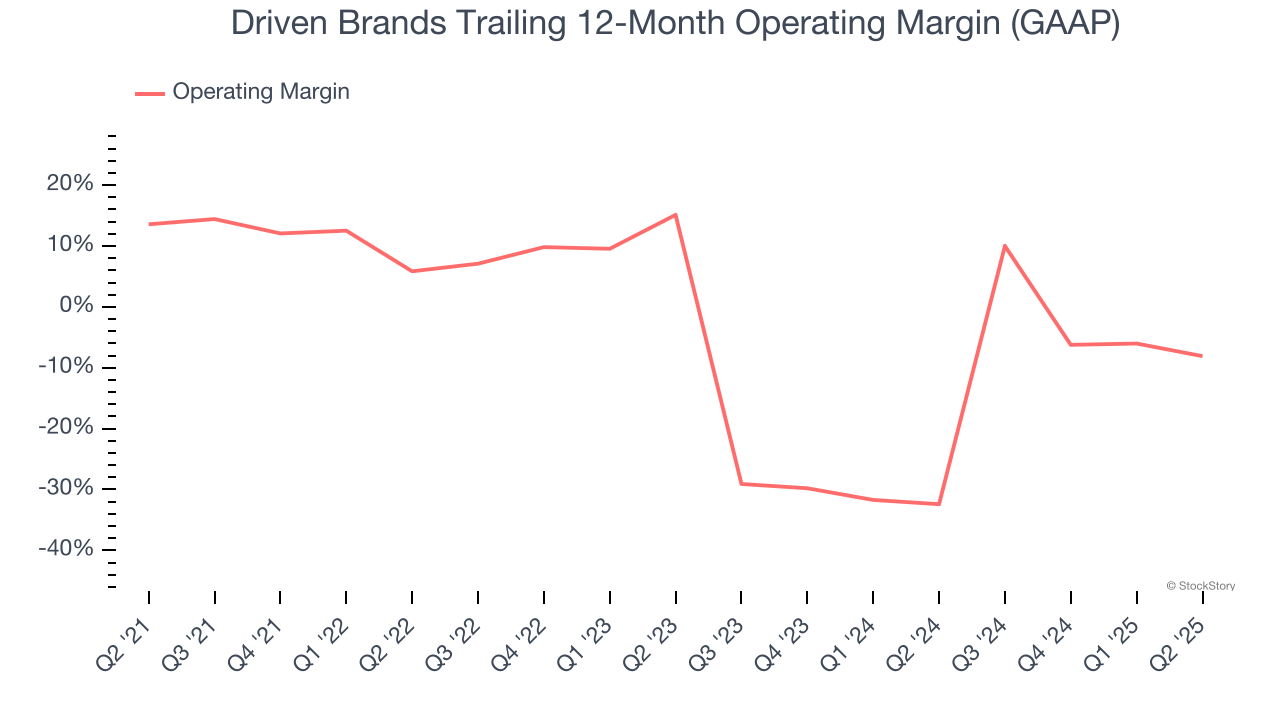
This quarter, Driven Brands generated an operating margin profit margin of 6.9%, down 6.2 percentage points year on year. This contraction shows it was less efficient because its expenses increased relative to its revenue.
We track the long-term change in earnings per share (EPS) for the same reason as long-term revenue growth. Compared to revenue, however, EPS highlights whether a company’s growth is profitable.
Driven Brands’s full-year EPS grew at an astounding 19.9% compounded annual growth rate over the last four years, better than the broader business services sector.
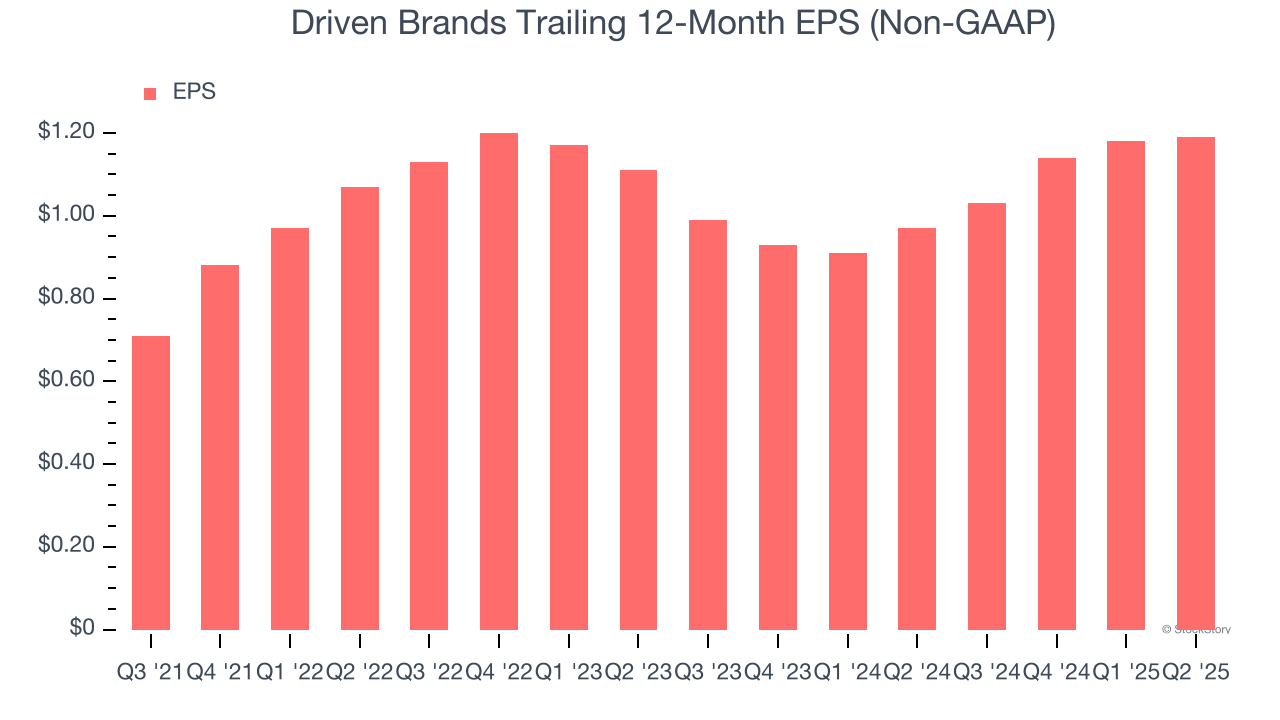
Like with revenue, we analyze EPS over a shorter period to see if we are missing a change in the business.
Driven Brands’s EPS grew at a weak 3.5% compounded annual growth rate over the last two years. On the bright side, this performance was higher than its flat revenue and tells us management responded to softer demand by adapting its cost structure.
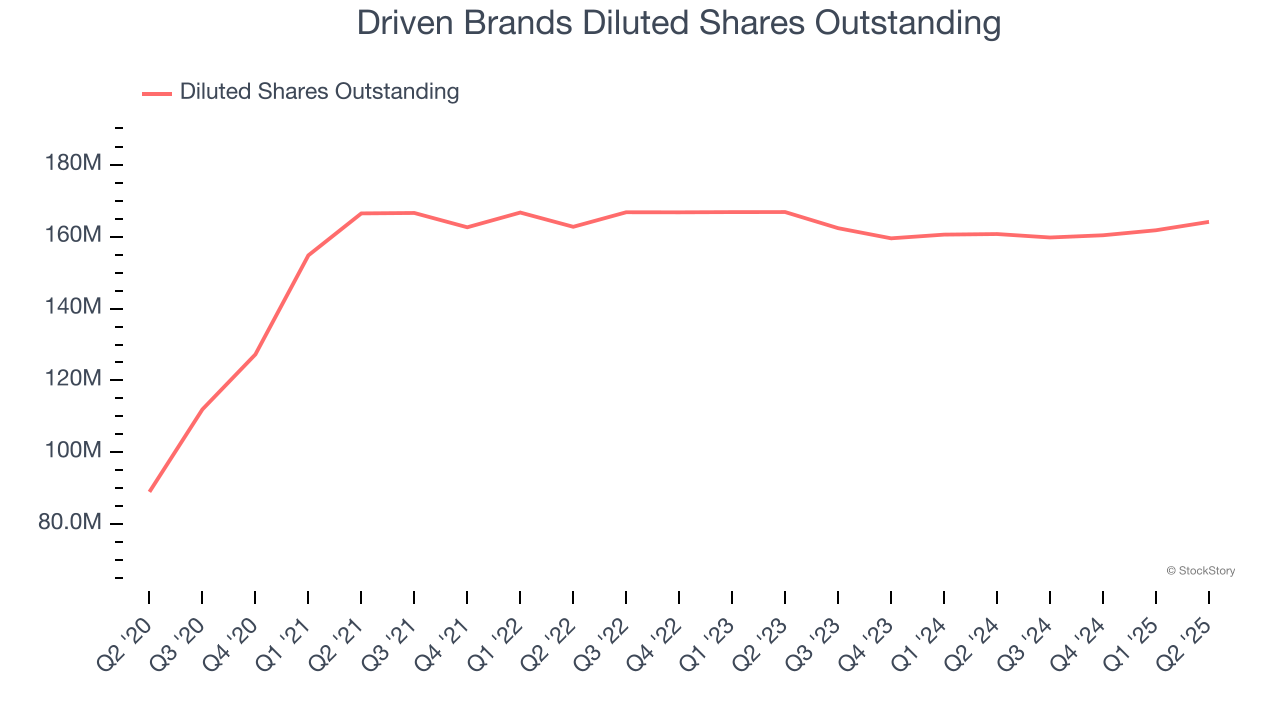
Diving into the nuances of Driven Brands’s earnings can give us a better understanding of its performance. A two-year view shows that Driven Brands has repurchased its stock, shrinking its share count by 1.6%. This tells us its EPS outperformed its revenue not because of increased operational efficiency but financial engineering, as buybacks boost per share earnings.
In Q2, Driven Brands reported adjusted EPS at $0.36, up from $0.35 in the same quarter last year. This print beat analysts’ estimates by 7.2%. Over the next 12 months, Wall Street expects Driven Brands’s full-year EPS of $1.19 to grow 16.5%.
We were impressed by how significantly Driven Brands blew past analysts’ same-store sales expectations this quarter. We were also happy its EPS outperformed Wall Street’s estimates. On the other hand, its full-year EBITDA guidance missed Wall Street’s estimates. Zooming out, we think this was a mixed quarter. The stock traded up 1.5% to $17.25 immediately after reporting.
Should you buy the stock or not? The latest quarter does matter, but not nearly as much as longer-term fundamentals and valuation, when deciding if the stock is a buy. We cover that in our actionable full research report which you can read here, it’s free.
| Jul-03 | |
| Jun-11 | |
| Jun-11 | |
| Jun-11 | |
| Jun-09 | |
| Jun-05 | |
| Jun-05 | |
| May-19 | |
| May-19 | |
| May-15 | |
| Apr-30 | |
| Apr-30 |
Activist Hedge Fund Makes Nearly $3 Billion Offer to Buy Meineke Owner
DRVN +6.51%
The Wall Street Journal
|
| Apr-22 | |
| Apr-21 | |
| Apr-21 |
Join thousands of traders who make more informed decisions with our premium features. Real-time quotes, advanced visualizations, alerts, and much more.
Learn more about Finviz Elite