|
|
|

|
|||||
|
|
|

Automotive services company Driven Brands (NASDAQ:DRVN) met Wall Streets revenue expectations in Q3 CY2025, but sales fell by 9.5% year on year to $535.7 million. On the other hand, the company’s full-year revenue guidance of $2.11 billion at the midpoint came in 0.6% below analysts’ estimates. Its non-GAAP profit of $0.34 per share was 13.6% above analysts’ consensus estimates.
Is now the time to buy Driven Brands? Find out by accessing our full research report, it’s free for active Edge members.
“Driven Brands delivered another strong quarter, highlighted by continued growth in our Take 5 business,” said Danny Rivera, President and CEO.
With approximately 5,000 locations across 49 U.S. states and 13 other countries, Driven Brands (NASDAQ:DRVN) operates a network of automotive service centers offering maintenance, car washes, paint, collision repair, and glass services across North America.
Examining a company’s long-term performance can provide clues about its quality. Even a bad business can shine for one or two quarters, but a top-tier one grows for years.
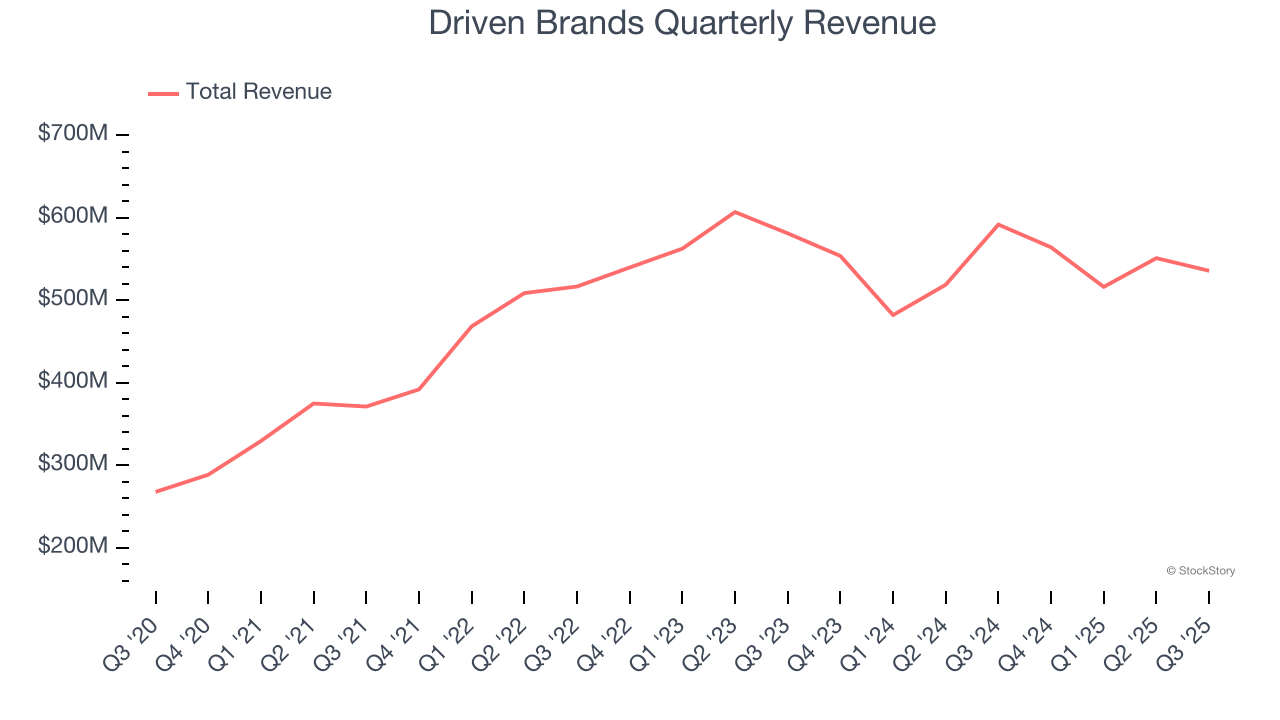
With $2.17 billion in revenue over the past 12 months, Driven Brands is a mid-sized business services company, which sometimes brings disadvantages compared to larger competitors benefiting from better economies of scale. On the bright side, it can still flex high growth rates because it’s working from a smaller revenue base.
As you can see below, Driven Brands’s 22.1% annualized revenue growth over the last five years was incredible. This shows it had high demand, a useful starting point for our analysis.
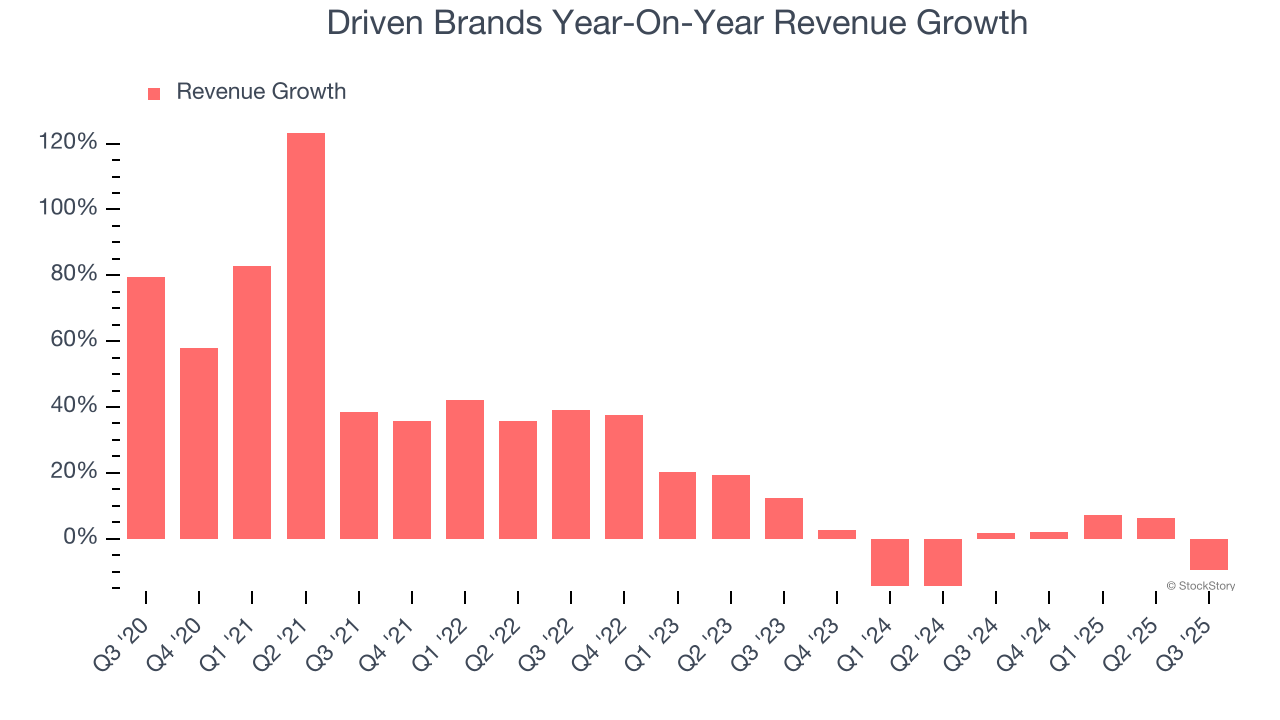
We at StockStory place the most emphasis on long-term growth, but within business services, a half-decade historical view may miss recent innovations or disruptive industry trends. Driven Brands’s recent performance marks a sharp pivot from its five-year trend as its revenue has shown annualized declines of 2.7% over the last two years.
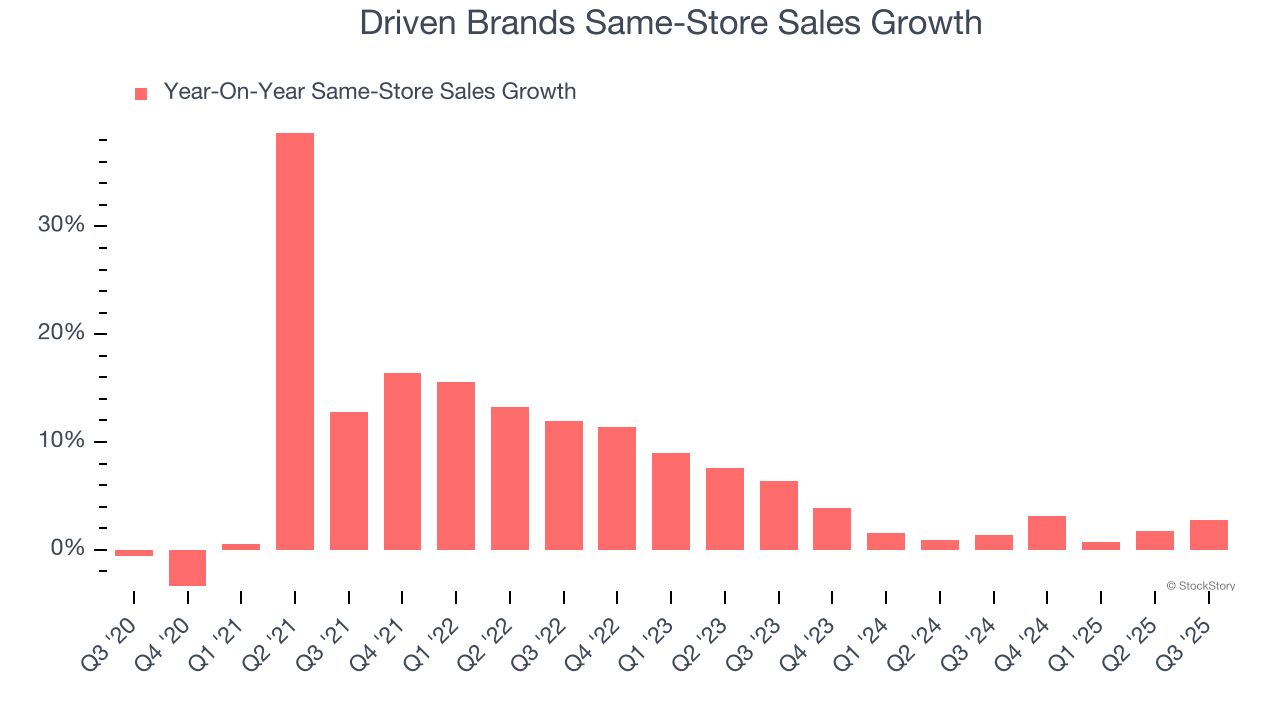
We can better understand the company’s revenue dynamics by analyzing its same-store sales, which show how much revenue its established locations generate. Over the last two years, Driven Brands’s same-store sales averaged 2% year-on-year growth. Because this number is better than its revenue growth, we can see its sales from existing locations are performing better than its sales from new locations.
This quarter, Driven Brands reported a rather uninspiring 9.5% year-on-year revenue decline to $535.7 million of revenue, in line with Wall Street’s estimates.
Looking ahead, sell-side analysts expect revenue to grow 4.1% over the next 12 months. Although this projection implies its newer products and services will fuel better top-line performance, it is still below the sector average.
Microsoft, Alphabet, Coca-Cola, Monster Beverage—all began as under-the-radar growth stories riding a massive trend. We’ve identified the next one: a profitable AI semiconductor play Wall Street is still overlooking. Go here for access to our full report.
Although Driven Brands was profitable this quarter from an operational perspective, it’s generally struggled over a longer time period. Its expensive cost structure has contributed to an average operating margin of negative 2.7% over the last five years. Unprofitable business services companies require extra attention because they could get caught swimming naked when the tide goes out. It’s hard to trust that the business can endure a full cycle.
Looking at the trend in its profitability, Driven Brands’s operating margin decreased by 21.7 percentage points over the last five years. This raises questions about the company’s expense base because its revenue growth should have given it leverage on its fixed costs, resulting in better economies of scale and profitability. Driven Brands’s performance was poor no matter how you look at it - it shows that costs were rising and it couldn’t pass them onto its customers.
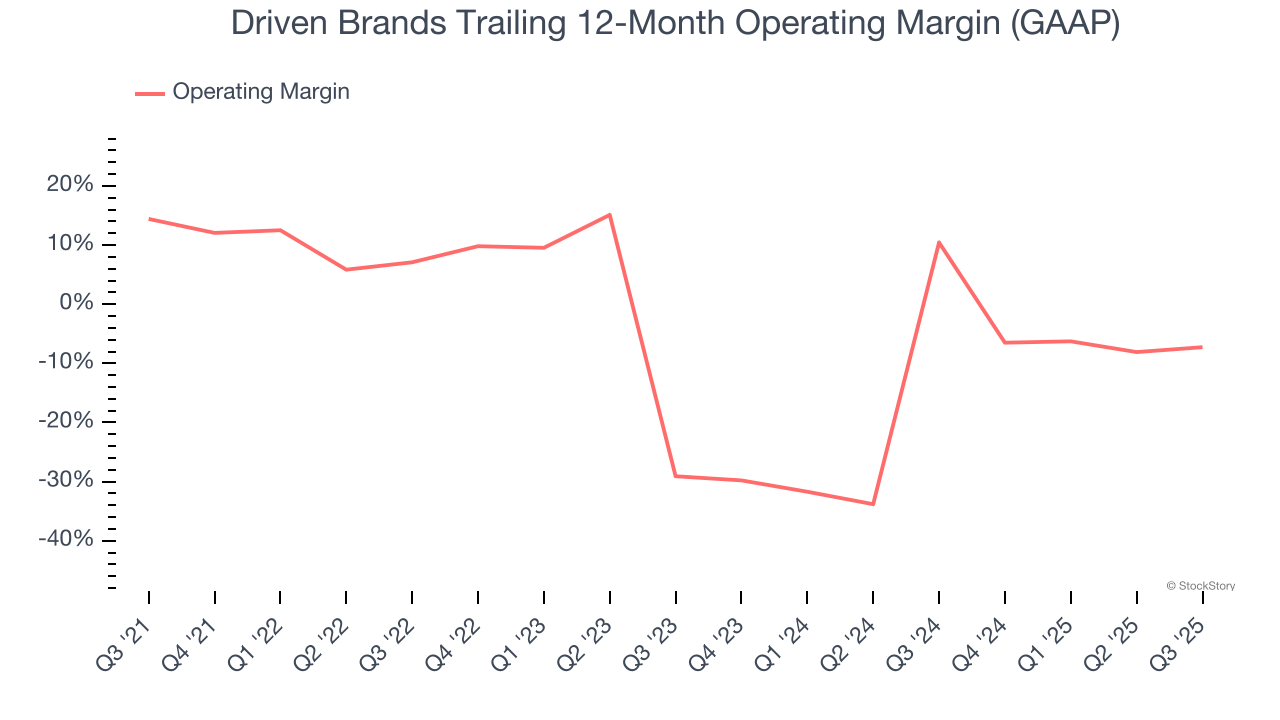
In Q3, Driven Brands generated an operating margin profit margin of 11.6%, up 4.9 percentage points year on year. This increase was a welcome development, especially since its revenue fell, showing it was more efficient because it scaled down its expenses.
Revenue trends explain a company’s historical growth, but the long-term change in earnings per share (EPS) points to the profitability of that growth – for example, a company could inflate its sales through excessive spending on advertising and promotions.
Driven Brands’s full-year EPS grew at an astounding 15.6% compounded annual growth rate over the last four years, better than the broader business services sector.
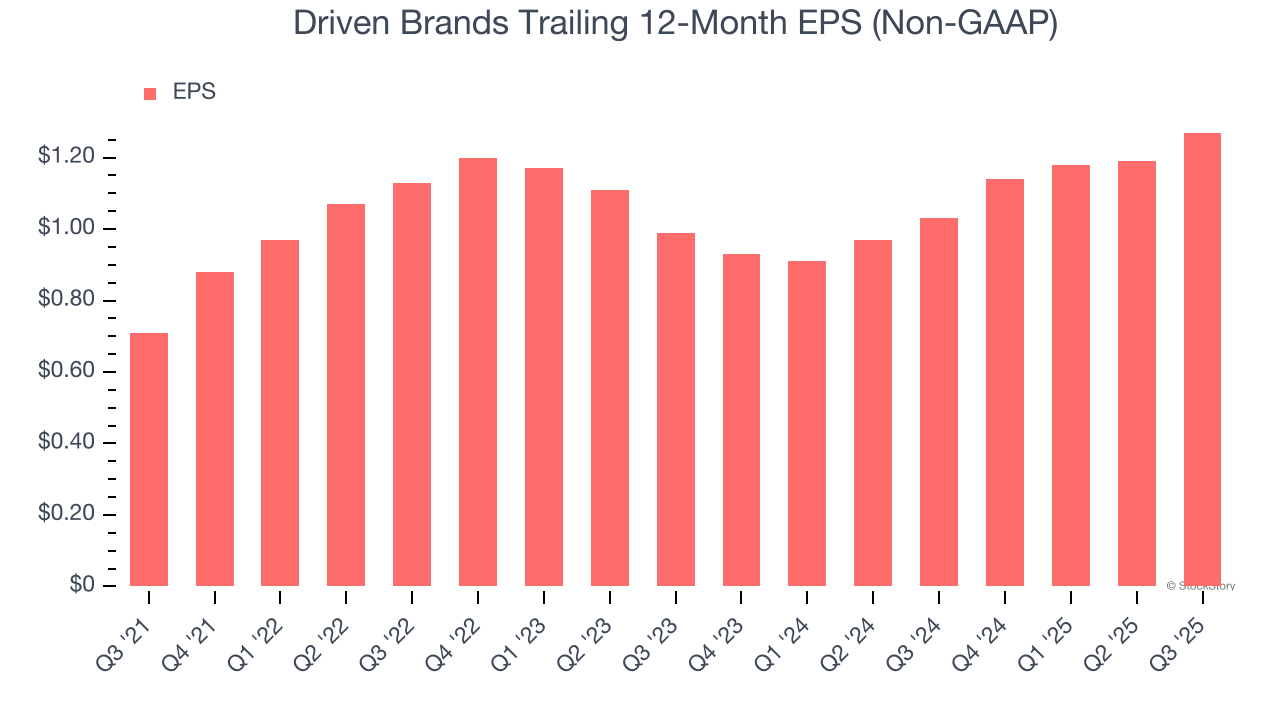
Like with revenue, we analyze EPS over a shorter period to see if we are missing a change in the business.
Driven Brands’s EPS grew at a solid 13.3% compounded annual growth rate over the last two years, higher than its 2.7% annualized revenue declines. This tells us management adapted its cost structure in response to a challenging demand environment.
We can take a deeper look into Driven Brands’s earnings to better understand the drivers of its performance. Driven Brands’s operating margin has expanded over the last two years. This was the most relevant factor (aside from the revenue impact) behind its higher earnings; interest expenses and taxes can also affect EPS but don’t tell us as much about a company’s fundamentals.
In Q3, Driven Brands reported adjusted EPS of $0.34, up from $0.26 in the same quarter last year. This print easily cleared analysts’ estimates, and shareholders should be content with the results. Over the next 12 months, Wall Street expects Driven Brands’s full-year EPS of $1.27 to grow 8%.
It was good to see Driven Brands beat analysts’ EPS expectations this quarter. We were also glad its full-year EPS guidance outperformed Wall Street’s estimates. On the other hand, its full-year revenue guidance slightly missed and its revenue was in line with Wall Street’s estimates. Overall, we think this was still a solid quarter with some key areas of upside. The stock remained flat at $14.25 immediately following the results.
Driven Brands had an encouraging quarter, but one earnings result doesn’t necessarily make the stock a buy. Let’s see if this is a good investment. We think that the latest quarter is only one piece of the longer-term business quality puzzle. Quality, when combined with valuation, can help determine if the stock is a buy. We cover that in our actionable full research report which you can read here, it’s free for active Edge members.
| Jul-03 | |
| Jun-11 | |
| Jun-11 | |
| Jun-11 | |
| Jun-09 | |
| Jun-05 | |
| Jun-05 | |
| May-19 | |
| May-19 | |
| May-15 | |
| Apr-30 | |
| Apr-30 |
Activist Hedge Fund Makes Nearly $3 Billion Offer to Buy Meineke Owner
DRVN +6.51%
The Wall Street Journal
|
| Apr-22 | |
| Apr-21 | |
| Apr-21 |
Join thousands of traders who make more informed decisions with our premium features. Real-time quotes, advanced visualizations, alerts, and much more.
Learn more about Finviz Elite