|
|
|

|
|||||
|
|
|
Last week, the U.S. markets experienced significant volatility. Major indexes, such as the Nasdaq Composite and the S&P 500, gained 1.88% and 0.94%, respectively, whereas the Dow Jones Industrial Average was largely flat. Investors are concerned about the health of the labor market and the impact of President Trump's escalating tariff threats, which could potentially slow down economic growth. However, strong corporate earnings have provided some sense of relief.
The Institute for Supply Management’s services purchasing managers' index, a key indicator for the U.S. economy, came in at 50.1% for the month of July, a narrow margin above the 50% mark that signals expansion. This marginal growth raised concerns about a potential slowdown in the dominant service sector, a significant driver of the nation's economy.
The number of Americans filing for jobless claims rose by 7,000 to 226,000 for the week ending Aug. 2, whereas continuing claims jumped by 38,000 to 1,974,000, the highest level since November 2021. The unemployment rate ticked up slightly to 4.2% in July, from 4.1% in June. Disappointing labor market data has put significant pressure on the Federal Reserve to balance its goal of controlling inflation and maintaining full employment. Market participants are optimistic that the Fed may consider a rate cut to support the economy in the near term.
On the global front, trade negotiations with China and other partners continued to create uncertainty, whereas the U.S.-EU trade agreement had a muted impact.
Regardless of market conditions, we, here at Zacks, provide investors with unbiased guidance on how to beat the market.
As usual, Zacks Research guided investors over the past three months with its time-tested methodologies. Given the prevailing market uncertainty, you may want to look at our feats to prepare better for your next action.
Here are some of our key achievements:
Shares of Digi Power X Inc. DGXX have gained 21.2% (versus the S&P 500’s 5.6% increase) since it was upgraded to a Zacks Rank #2 (Buy) on June 13.
Another stock, Artisan Partners Asset Management Inc. APAM, which was upgraded to a Zacks Rank #1 (Strong Buy) on June 9, has returned 13.2% (versus the S&P 500’s 6.4% increase) since then.
Zacks Rank #1 stocks returned +6.51% in May 2025, which compares to +4.47% for the S&P 500 index and +4.12% for the equal-weight version of the index. This follows the Zacks Rank # 1 stocks’ +17.96% return in April vs. +15.04% for the S&P 500 index.
A hypothetical portfolio of Zacks Rank # 1 (Strong Buy) stocks returned +3.39% in 2025 (through July 7th) vs. +5.19% for the S&P 500 index and +3.63% for the equal-weight version of the index.
This portfolio returned +22.4% in 2024, vs. +28% for the S&P 500 index and +19.9% for the equal-weight version of the S&P 500 index.
This hypothetical portfolio returned +20.65% in 2023 vs. +24.83% for the S&P 500 index and +15% for the equal-weight S&P 500 index.
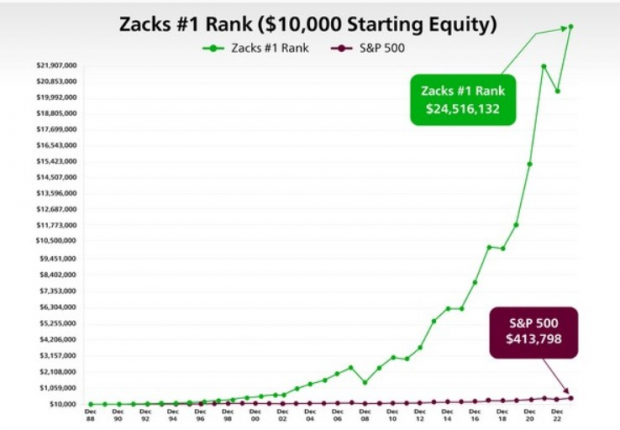
The Zacks Model Portfolio - consisting of Zacks Rank #1 stocks – has outperformed the S&P index by more than 12 percentage points since 1988 (through June 2nd, 2025, the Zacks # 1 Rank stocks generated an annualized average return of +23.5% vs. +11% for the S&P 500 index).
You can see the complete list of today’s Zacks Rank #1 stocks here >>>
Check Digi Power X’s historical EPS and Sales here>>>
Check Artisan Partners Asset Management’s historical EPS and Sales here>>>
Shares of RF Industries, Ltd. RFIL and Federated Hermes, Inc. FHI have advanced 43.2% (versus the S&P 500’s 7% increase) and 20.7% (versus the S&P 500’s 7.3% increase) since their Zacks Recommendation was upgraded to Outperform on June 20 and June 23, respectively.
While the Zacks Rank is our short-term rating system that is most effective over the one- to three-month holding horizon, the Zacks Recommendation aims to predict performance over the next 6 to 12 months. However, just like the Zacks Rank, the foundation for the Zacks Recommendation is trends in earnings estimate revisions.
The Zacks Recommendation classifies stocks into three groups — Outperform, Neutral and Underperform. While these recommendations are determined quantitatively, our analysts have the flexibility to override them for the 1100+ stocks they closely follow based on their better judgment of factors such as valuation, industry conditions and management effectiveness than the quantitative model.
To access our research reports with Zacks Recommendations for the 1100+ stocks we cover, click here>>>
Shares of Shopify Inc. SHOP, which belongs to the Zacks Focus List, have gained 63% over the past 12 weeks. The stock was added to the Focus List on September 6, 2022. Another Focus-List holding, Intellia Therapeutics, Inc. NTLA, which was added to the portfolio on March 7, 2023, has returned 32.9% over the past 12 weeks. The S&P 500 has advanced by 12.9% over this period.
The 50-stock Focus List portfolio returned 8.84% in 2025 (through June 30th, 2025) vs. +6.21% for the S&P 500 index and +4.82% for the equal-weight version of the index.
The Zacks Focus List portfolio returned +18.41% in 2024 vs. +25.04% for the S&P 500 index and +13% for the equal-weight S&P 500 index. The portfolio had returned +29.54% in 2023 vs. +26.28% for the S&P 500 index and +13.61% for the equal-weight S&P 500 index. In 2022, the portfolio returned -15.2% vs. the S&P 500 index’s -17.96%.
The portfolio leads the broader market over the preceding one, three, five and ‘since 2004’ periods. These annualized return comparisons are: +22.27% for the Focus List vs. +15.18% for the index over the one-year period, +22.61% vs. +19.71% over the 3-year period, +17.79% vs. +16.64% over the 5-year period, and +11.85% vs. +11.44% since 2004.
Unlock all of our powerful research, tools and analysis, including the Focus List, Zacks #1 Rank List, Equity Research Reports, Zacks Earnings ESP Filter, Premium Screener and more, as part of Zacks Premium. Gain full access now >>
Mettler-Toledo International Inc. MTD, a component of our Earnings Certain Admiral Portfolio (ECAP), has jumped 16.2% over the past 12 weeks. Intuit Inc. INTU has followed Mettler-Toledo International with 14.6% returns.
The Zacks Earnings Certain Admiral Portfolio (ECAP), which consists of 30 concentrated, ultra-defensive, long-term Buy-and-Hold stocks, returned +0.20% in the second quarter of 2025 vs. the S&P 500 index’s +10.94% gain (SPY ETF). In the year-to-date period through June 30th, the portfolio returned +3.93% vs. +6.20% gain for the S&P 500 index.
For the year 2024, the portfolio returned +16.26% vs. +24.89% for the S&P 500 index (SPY ETF).
In 2023, the portfolio returned +12.17% vs. +26.28% for the S&P 500 index. The portfolio returned -4.7% in 2022 vs. the S&P 500 index’s -17.96%.
With little to no turnover and annual rebalance periodicity, ECAP seeks to minimize capital loss by holding shares of companies whose earnings streams exhibit a proven 20+ year track record of surviving recessionary periods with minimal impact on aggregate earnings growth relative to the overall S&P 500.
The ECAP and many other model portfolios are available as part of Zacks Advisor Tools, a cloud-based solution to access Zacks award-winning stock, mutual fund and ETF research. Click here to schedule a demo.
Starbucks Corporation SBUX, which is part of our Earnings Certain Dividend Portfolio (ECDP), has returned 14.7% over the past 12 weeks. Another ECDP stock, Johnson & Johnson JNJ, has increased 12.4% over the same time frame. Of course, the inclination of investors toward quality dividend stocks to secure an income stream amid heightened market volatility contributed to this performance.
Check Starbucks’ dividend history here>>>
Check Johnson & Johnson's dividend history here>>>
With an extremely low beta and a history of minimum earnings variability over the last 20+ years, this 25-stock portfolio helps to significantly mitigate risk.
The Zacks Earnings Certain Dividend Portfolio (ECDP) returned -3.17% in 2025 Q2 vs. the S&P 500 index’s +10.94% gain and the Dividend Aristocrats ETF’s (NOBL) -0.09% return. Year-to-date (through June 30th), the portfolio returned +2.38% vs. +2.18% gain for the Dividend Aristocrat ETF.
For the full year 2024, the portfolio returned +6.95% vs. +24.89% for the S&P 500 index and +6.72% for NOBL.
The portfolio returned -0.9% in 2023 vs. +26.28% for the S&P 500 index and +8.11% for NOBL. The portfolio returned -2.3% in 2022 vs. -17.96% for the S&P 500 index and -8.34% for NOBL.
Click here to access this portfolio on Zacks Advisor Tools.
The Goldman Sachs Group, Inc. GS, from the Zacks Top 10 Stocks for 2025, has jumped 26% year to date compared with the S&P 500 index’s 8.8% increase.
The Top 10 portfolio returned +11.8% this year (through the end of June 2025) vs. +6.2% for the S&P 500 index and +4.8% for the equal-weight version of the index.
The Top 10 portfolio returned +62.98% in 2024, vs. +25.04% for the S&P 500 index and +13% for the equal-weight version of the index. The portfolio had returned +25.15% in 2023 vs. +26.28% for the S&P 500 index.
Since 2012, the Top 10 portfolio has produced a cumulative return of +2,246.8% through the end of June 2025 vs. +502.3% for the S&P 500 index and +373.4% for the equal-weight version of the index. The portfolio has produced an average return of +26.3% in the period 2012 through June 30, 2025, vs. +14.3% for the S&P 500 index and +12.2% for the equal-weight version of the index.
Want the latest recommendations from Zacks Investment Research? Today, you can download 7 Best Stocks for the Next 30 Days. Click to get this free report
This article originally published on Zacks Investment Research (zacks.com).
| 1 hour | |
| 2 hours | |
| 3 hours | |
| 3 hours | |
| 3 hours | |
| 4 hours | |
| 4 hours | |
| 5 hours | |
| 5 hours | |
| 5 hours | |
| 6 hours | |
| 7 hours | |
| 7 hours | |
| Jul-20 | |
| Jul-20 |
Join thousands of traders who make more informed decisions with our premium features. Real-time quotes, advanced visualizations, alerts, and much more.
Learn more about Finviz Elite