|
|
|

|
|||||
|
|
|
Subscribers to Chart of the Week received this commentary on Sunday, August 9.
Since Schaeffer’s just turned 44, we figured it was time to grow up a little. The days of tacking on a Sentiment magazine (yes, an actual physical magazine) to our Options Advisor newsletter are long gone. Now we have big plans we’re excited to share: newsletters, podcasts, video content, and a shiny new website. We want to use all these mediums to inform and entertain a new generation of investors through additive information about the stock market, options trends, and anything adjacent to investing.
That means migrating this service over to Substack, an email-based subscription platform. Chart of the Week will still be delivered to your inboxes, but we want to participate in as many conversations as possible, and Substack makes that possible.
Below is an example. Chart of the Week will still offer a look at AMAT, but to see the rest of the charts that caught our eye recently, subscribe below to our (free) Substack.
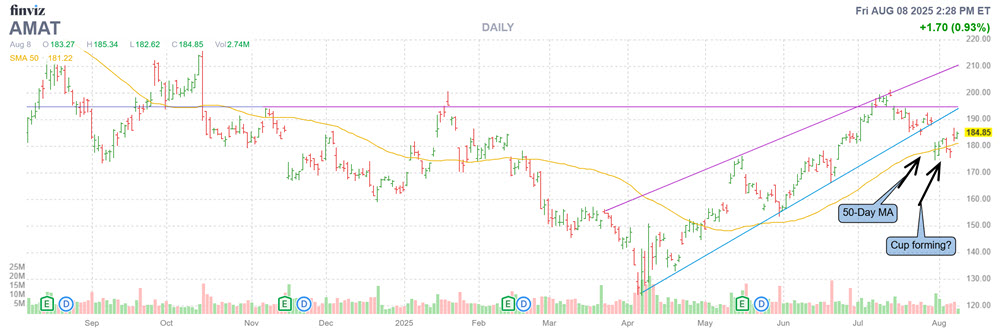
Senior V.P. of Research Todd Salamone sent us an intriguing Applied Materials Inc (NASDAQ:AMAT) chart earlier this week. This comes ahead of the semiconductor supplier’s fiscal third-quarter earnings, due out after the market closes on Thursday, Aug. 14.
AMAT’s recent pullback from scraping $200 in late July could be the handle of a “cup-and-handle” pattern. We’ve seen this pattern in many individual stocks in recent weeks. In some cases, the “handle,” aka pullback, finds support in the vicinity of the underlying’s 50-day moving average. This precedes a breakout above the rim, which in AMAT’s case happens to be that round $200 level.
Cue the alarm bells and eye emojis.
In the chart below, the shares are also holding the $175 level, which marked a low back in September of last year and was resistance as recently as May. A share buyback plan announced in March could be supportive on a macro level, although there typically isn’t buyback activity in the days leading up to an earnings report, so keep that in mind.
A share buyback plan announced in March could be supportive, although there typically isn’t buyback activity in the days leading up to an earnings report, so keep that in mind.
For what it’s worth, in the last five years, the stock has averaged a nearly 8% return 21 trading days after “pullbacks” to its 50-day moving average. By “pullbacks,” we mean the shares are above the trendline at least 80% of the time during the last two months and above it at least eight of the past 10 trading days.
There’s a tremendous amount of pessimism around Applied Materials, at least from an options perspective. Speculative players have been buying to open puts relative to calls at a quicker-than-usual clip. At the International Securities Exchange (ISE), Chicago Board Options Exchange (CBOE), and NASDAQ OMX PHLX (PHLX), the stock’s 10-day put/call volume ratio of 2.37 ranks four percentage points from an annual high. Echoing this, AMAT’s Schaeffer's put/call open interest ratio (SOIR) of 1.17 sits in the 87th percentile of its annual range, indicating that near-term traders have rarely been less call biased in the past 12 months.
We’ll always try to mention risks that look obvious. One that sticks out like a sore thumb is AMAT’s dismal post-earnings history over the last two years. Per Trade-Alert, five of the stock’s last eight post-earnings moves have been negative, including a 5.3% bear gap back in May. Overall, the equity averaged a post-earnings move of 4.9% — regardless of direction — in the last two years. This time around for Friday the 15th, the options market is pricing in a larger-than-usual post-earnings move of 7.3%, regardless of direction.
Idea: Take a flier on buying out-of-the-money (OOTM) short-term puts to hedge earnings risk, and a longer-term call to leverage the intriguing technical setup outlined above.
UPDATE: Since Todd flagged AMAT, the stock gapped higher by 2.8% on Aug. 7 and closed the week up xx. There’s still room to run, but that cup-and-handle pattern is much more confirmed now. Keep those late-week gains in mind for your models, folks!
Earnings Dingers Everywhere Senior Market Strategist Matthew Timpane (another name to watch!) flagged us this stat from Goldman Sachs: What this means is that across S&P 500 names reporting earnings this season, options were priced too cheap compared to their implied move via a hypothetical straddle. In other words, most earnings have had a realized implied move greater than the straddle implied number. So say the average implied move was 10 points. Typically, earnings on average would come in less, like eight points. For this earnings season, they’re coming in around 11 or 12 points, which means market makers are underpricing earnings volatility. Something to chew on for sure for the final portions of earnings #szn. People Helping People A special thank you to our chart wizard friends at FinViz for the shoutout on X, the everything app. Speaking of X, we’re about 100 followers from 10k. We’re deep in our process trying to figure out a way to celebrate. Watch this space for more! Sentiment Watch We love using the National Association of Active Investment Managers (NAAIM), the American Association of Individual Investors (AAII), and Investors Intelligence (II) polls to gauge sentiment. This week, the NAAIM and AAII surveys diverged. Active fund managers are joining the party, with an exposure index of 96.25. It’s the lowest standard deviation of responses since March 2024. The latest AAII reading from Aug. 6 shows a 43.2% bearish reading, the highest since May and in the 90th percentile of all-time readings. So retail traders are paddling to safety while active fund managers suddenly dip their toe in the water. Do with that information what you will.
Click Here to view the rest on Schaeffer’s Substack!
| 4 hours | |
| Feb-14 | |
| Feb-14 | |
| Feb-14 | |
| Feb-14 | |
| Feb-14 | |
| Feb-14 | |
| Feb-13 | |
| Feb-13 |
Stocks to Watch Friday Recap: Applied Materials, Coinbase, DraftKings
AMAT +8.08%
The Wall Street Journal
|
| Feb-13 | |
| Feb-13 | |
| Feb-13 | |
| Feb-13 | |
| Feb-13 | |
| Feb-13 |
Join thousands of traders who make more informed decisions with our premium features. Real-time quotes, advanced visualizations, backtesting, and much more.
Learn more about FINVIZ*Elite