|
|
|

|
|||||
|
|
|
YieldMax MSTR Option Income Strategy ETF (MSTY) generates income by selling options and other derivatives tied to Strategy (MSTR), which was formerly known as MicroStrategy.
The fund’s monthly distributions can be large, but payouts are volatile and closely linked to Strategy and Bitcoin moves.
There are downsides to the generous cash distributions, as large checks typically match up with significant dips in the ETF price.
YieldMax MSTR Option Income Strategy ETF (NYSEMKT: MSTY) is kind of a weird beast. Let's walk down the ladder of strangeness, starting with a really basic stock market tracker and ending up with the YieldMax fund. The route goes straight through the cryptocurrency corner of Wall Street:

Image source: Getty Images.
Where to invest $1,000 right now? Our analyst team just revealed what they believe are the 10 best stocks to buy right now. Continue »
As you might imagine, the ETF's payouts aren't stable at all. After 18 monthly cash distributions in this ETF's short history, the monthly payout has varied from $1.09 to $4.42 per share. The peak payouts have come in periods of extreme Strategy volatility, usually based on corresponding Bitcoin moves.
To be clear, the total return (with DRIP enabled) on the YieldMax ETF usually sticks fairly close to Strategy's stock chart. The fund price is firmer and generally higher when the volatility-based payouts are lower.
So you win some and lose some, but even the weakest monthly payout so far can be extrapolated to an annual distribution yield of 128%. Yes, the latest payout is the smallest one on the fund's distribution ledger. The ETF's price is down 26.9% since its inception in February 2024, but the total return more than tripled anyhow.
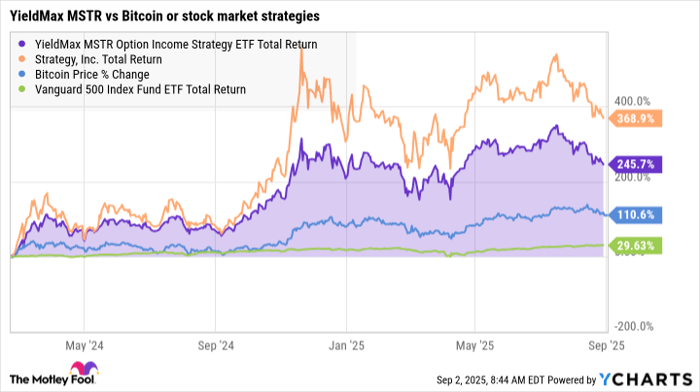
MSTY Total Return Level data by YCharts
As seen in the chart, the YieldMax MSTR ETF's total return has delivered market-beating returns so far. It has not kept up with Strategy's massive gains, though.
However, there's an upside to the fund's occasional divergence from the underlying stock's performance. Zooming in on negative periods like the three-month span from December 2024 to February 2025, you'll see milder downtrends in YieldMax fund's total return than in Strategy's chart:
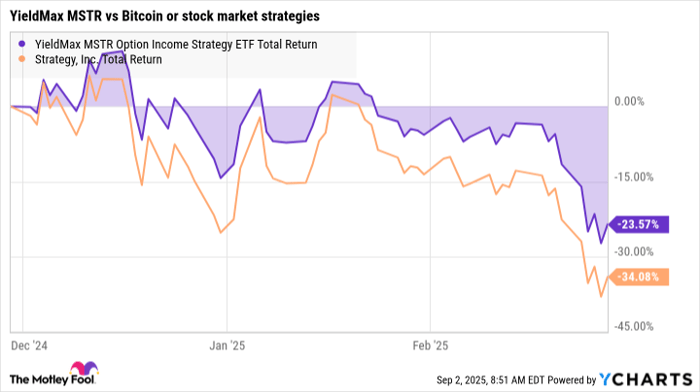
MSTY Total Return Level data by YCharts
So this fund acts as a modest buffer against Strategy's rambunctious volatility, usually staying closer to the break-even line than the actual stock. I always assume you're running an active DRIP plan, of course. The pure price chart will always favor Strategy's stock over the options-based ETF.
Where will the YieldMax MSTR Option Income Strategy ETF go in the next year, then? Well, that depends on what you expect from Strategy, which largely depends on Bitcoin's progress. Some expect a significant Bitcoin jump in the second half of 2025, targeting million-dollar coin prices as early as 2030. Other investors see a cryptocurrency downturn around the bend, as the Bitcoin halving cycle prepares for the next refresh in 2028. Macroeconomic turmoil can undermine or support either thesis at this point.
It's time to pick a rung on that ladder of crypto-related exposure and risk. Bitcoin bulls can go for direct investments or spot Bitcoin ETFs. Crypto bears should prefer broad index funds instead. Only the most adventurous investors should consider Strategy's stock, or the weirder but somewhat lower-risk YieldMax MSTR ETF.
Before you buy stock in Tidal Trust II - YieldMaxTM Mstr Option Income Strategy ETF, consider this:
The Motley Fool Stock Advisor analyst team just identified what they believe are the 10 best stocks for investors to buy now… and Tidal Trust II - YieldMaxTM Mstr Option Income Strategy ETF wasn’t one of them. The 10 stocks that made the cut could produce monster returns in the coming years.
Consider when Netflix made this list on December 17, 2004... if you invested $1,000 at the time of our recommendation, you’d have $654,759!* Or when Nvidia made this list on April 15, 2005... if you invested $1,000 at the time of our recommendation, you’d have $1,046,799!*
Now, it’s worth noting Stock Advisor’s total average return is 1,042% — a market-crushing outperformance compared to 183% for the S&P 500. Don’t miss out on the latest top 10 list, available when you join Stock Advisor.
*Stock Advisor returns as of August 25, 2025
Anders Bylund has positions in Bitcoin, Tidal Trust II - YieldMaxTM Mstr Option Income Strategy ETF, Vanguard S&P 500 ETF, and iShares Bitcoin Trust. The Motley Fool has positions in and recommends Bitcoin and Vanguard S&P 500 ETF. The Motley Fool recommends Coinbase Global. The Motley Fool has a disclosure policy.
| Jul-11 | |
| Jul-10 | |
| Jul-10 | |
| Jul-10 | |
| Jul-10 | |
| Jul-10 | |
| Jul-10 | |
| Jul-10 | |
| Jul-10 | |
| Jul-10 | |
| Jul-10 | |
| Jul-10 | |
| Jul-09 | |
| Jul-09 | |
| Jul-09 |
Join thousands of traders who make more informed decisions with our premium features. Real-time quotes, advanced visualizations, alerts, and much more.
Learn more about Finviz Elite