|
|
|

|
|||||
|
|
|
There are better and worse times to start buying stocks.
Bull and bear markets are a normal part of the stock market.
Wall Street history tells a very compelling story that investing, at any time, is better than not investing.
After three months without a winner, two different people will now split the nearly $1.8 billion Powerball Jackpot. As lottery advertising frequently says, you gotta be in it to win it. But the chances of winning that historic jackpot were roughly 1 in 292 million!
You have much better odds of "winning" if you invest in the S&P 500 (SNPINDEX: ^GSPC), a fact that remains true even as the index sits near all-time highs. Here's why now is as good a time as any to start buying the S&P 500.
Where to invest $1,000 right now? Our analyst team just revealed what they believe are the 10 best stocks to buy right now. Learn More »
The purpose of the S&P 500 index is to be representative of the broader U.S. economy. A committee selects roughly 500 businesses for the index that it believes are large and economically important based on certain criteria. The stocks of those businesses are market-cap weighted and combined to form the index, and it provides a relatively fair representation of the broader U.S. economy. Investors can easily buy the entire S&P 500 index via a mutual fund or an exchange-traded fund (ETF).

Image source: Getty Images.
The S&P 500 is, practically speaking, what most people think of when they say "the market." Here's the thing about the market: It tends to ride a pendulum, swinging between bull markets and bear markets. Or, more simply, good performance is often followed by bad performance, and vice versa. That's partly a result of economic and business cycles, but it also highlights the emotional nature of investing.
When times are good on Wall Street, investors worry that a reversal is on the way. The truth of the matter is that history suggests that there will, indeed, be a reversal of performance. But that's just how things go for investors. It shouldn't stop you from investing. The proof of that is highlighted in the graph below, which shows that the S&P 500 index has tended to rise over the long term. Even the worst downturns have, in the end, been little more than bumps on the road higher.
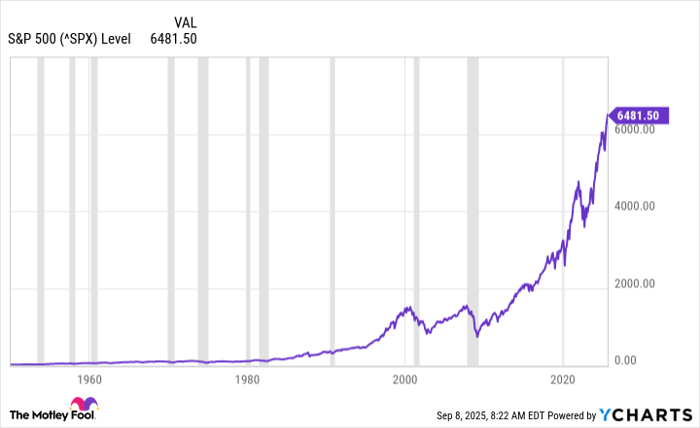
Data by YCharts.
If you buy and hold for the long term, history suggests that you will still come out ahead of the game. So if fear has you sitting on the fence, it is probably better for you to start investing than to wait and try to time the "perfect" point to become an investor.
That said, to be completely fair, there are better and worse times to invest. When the market is in the throes of a bear market, stock valuations are, by definition, relatively attractive. In a bull market, prices are likely to be elevated. So what would have happened if you'd bought in the end of the last two giant bull markets (that also happened to end in very deep bear markets)?
If you'd bought on the first trading day in 2000, right before the dot.com crash, your gain would be 345% today. That's not bad considering that the bear market around that period lasted until early 2003. The downturn's size? An over 40% decline in the S&P 500 index. It was a brutal time to be an investor, but if you'd just stuck with an S&P 500 index fund, such as the SPDR S&P 500 Index ETF (NYSEMKT: SPY), you'd have ended up OK.
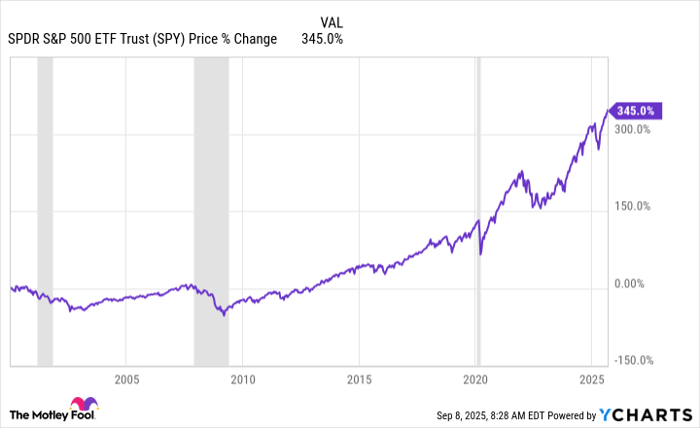
Data by YCharts.
How about if you'd bought in early 2007, just before the bear market and the recession at the time? Note that this economic downturn was so bad that there were legitimate fears that the entire world economic order would collapse. It was dubbed the Great Recession, in a nod to the Great Depression. Once again, buying and holding the S&P 500 index, with an ETF like the Vanguard S&P 500 ETF (NYSEMKT: VOO), would have worked out just fine. An investment in the S&P 500 on the first trading day of January 2007 would have left you with a gain of around 355% today.
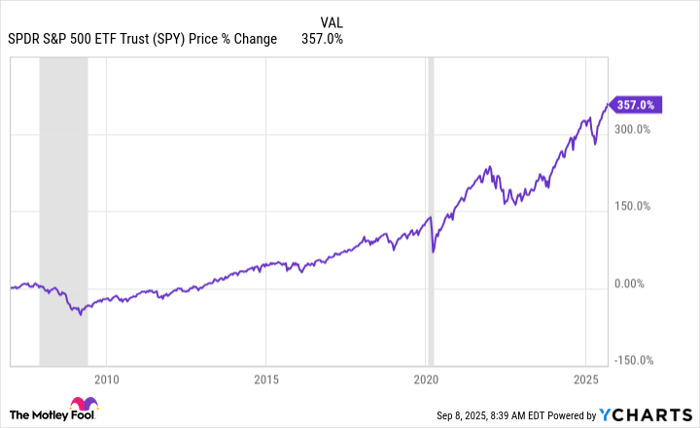
Data by YCharts.
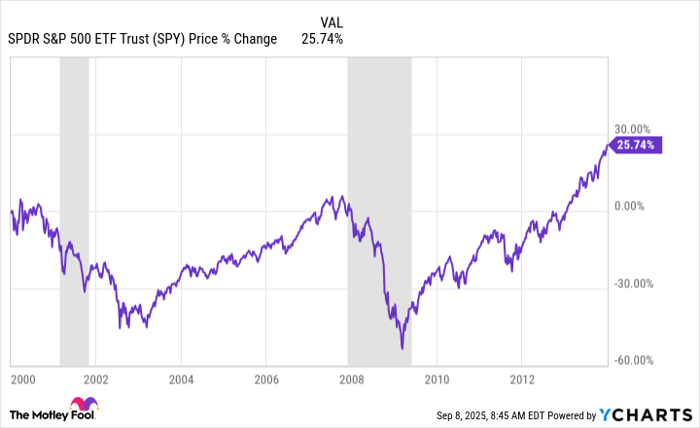
How can the returns from peaks just prior to those two downturns be so similar? The answer is that after the market got back to breakeven following the dot.com crash, it promptly fell again during the Great Recession. It wasn't until 2013 that the S&P 500 index finally broke above the peaks it hit in both 2000 and 2007. That is, of course, a long time to wait for a recovery if you had invested at the highs.
However, investing at what would have been very bad times shows the value of taking the long-term approach when it comes to investing. Today, those two drops, which were huge at the time, are a distant memory. Meanwhile, if you had continued to invest regularly all along, known as dollar-cost averaging, and reinvested your dividends, you would have done even better. These are two key tactics that long-term investors take.
If you put money into the market today, there is a very good chance that a bear market will come along and leave you with paper losses. You might have to sit with those paper losses for years. But history says that sticking it out and continuing to invest will result in you having solid long-term returns just the same.
You can wait for a correction if you want, but being in the market is often more important. After all, knowing the exact right time to buy is just as difficult as knowing the exact right time to sell (and probably about as difficult as picking the right numbers on the Powerball lottery). Few on Wall Street have ever consistently picked the right time on either side of the market's pendulum swing.
Before you buy stock in S&P 500 Index, consider this:
The Motley Fool Stock Advisor analyst team just identified what they believe are the 10 best stocks for investors to buy now… and S&P 500 Index wasn’t one of them. The 10 stocks that made the cut could produce monster returns in the coming years.
Consider when Netflix made this list on December 17, 2004... if you invested $1,000 at the time of our recommendation, you’d have $671,288!* Or when Nvidia made this list on April 15, 2005... if you invested $1,000 at the time of our recommendation, you’d have $1,031,659!*
Now, it’s worth noting Stock Advisor’s total average return is 1,056% — a market-crushing outperformance compared to 185% for the S&P 500. Don’t miss out on the latest top 10 list, available when you join Stock Advisor.
*Stock Advisor returns as of September 8, 2025
Reuben Gregg Brewer has no position in any of the stocks mentioned. The Motley Fool has positions in and recommends Vanguard S&P 500 ETF. The Motley Fool has a disclosure policy.
| May-11 | |
| May-11 | |
| May-08 | |
| May-06 | |
| May-06 | |
| May-05 | |
| May-01 | |
| Apr-30 | |
| Apr-30 | |
| Apr-29 | |
| Apr-29 | |
| Apr-29 | |
| Apr-29 | |
| Apr-28 | |
| Apr-28 |
Join thousands of traders who make more informed decisions with our premium features. Real-time quotes, advanced visualizations, alerts, and much more.
Learn more about Finviz Elite